

Optimized logic rules reveal interferon-γ-induced modes regulated by histone deacetylases and protein tyrosine phosphatases
- PMID: 28054346
- PMCID: PMC5382347
- DOI: 10.1111/imm.12707
Optimized logic rules reveal interferon-γ-induced modes regulated by histone deacetylases and protein tyrosine phosphatases
Abstract
The pro-inflammatory cytokine interferon-γ (IFN-γ) is critical for activating innate and adaptive immunity against tumours and intracellular pathogens. Interferon-γ is secreted at the fetal-maternal interface in pregnant women and mice. The outer layer of the placenta in contact with maternal blood is composed of semi-allogeneic trophoblast cells, which constitute the fetal component of the fetal-maternal interface. The simultaneous presence of pro-inflammatory IFN-γ and trophoblast cells at the fetal-maternal interface appears to represent an immunological paradox, for trophoblastic responses to IFN-γ could potentially lead to activation of maternal immunity and subsequent attack of the placenta. However, our previous studies demonstrate that IFN-γ responsive gene (IRG) expression is negatively regulated in human and mouse trophoblast cells. In human cytotrophoblast and trophoblast-derived choriocarcinoma cells, janus kinase signalling is blocked by protein tyrosine phosphatases (PTPs), whereas in mouse trophoblast, histone deacetylases (HDACs) inhibit IRG expression. Here, we used genome-wide transcriptional profiling to investigate the collective roles of PTPs and HDACs on regulation of IRG expression in human choriocarcinoma cells. Logic-rules were optimized to derive regulatory modes governing gene expression patterns observed upon different combinations of treatment with PTP and HDAC inhibitors. The results demonstrate that IRGs can be divided into several categories in human choriocarcinoma cells, each of which is subject to distinct mechanisms of repression. Hence, the regulatory modes identified in this study suggest that human trophoblast and choriocarcinoma cells may evade the potentially deleterious consequences of exposure to IFN-γ by using several overlapping mechanisms to block IRG expression.
Keywords: choriocarcinoma; interferon-γ signalling; logics; pervanadate; valproic acid.
© 2017 John Wiley & Sons Ltd.
Figures
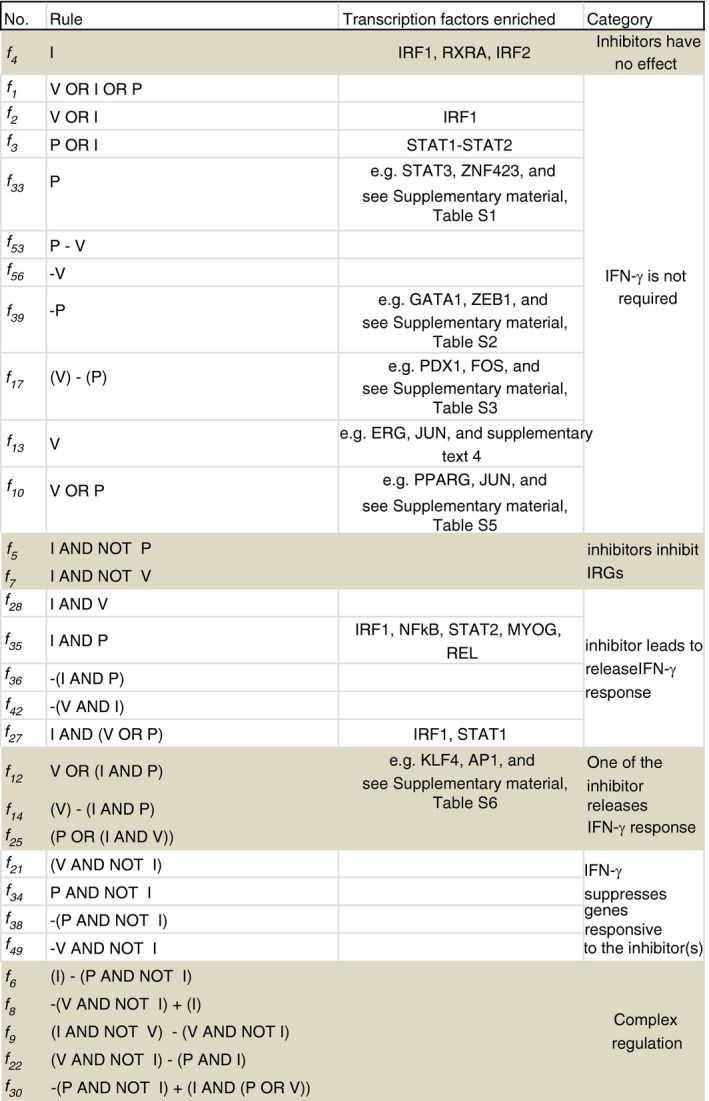
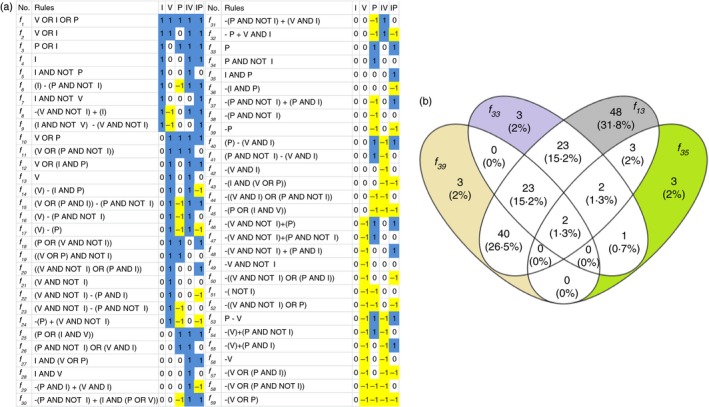
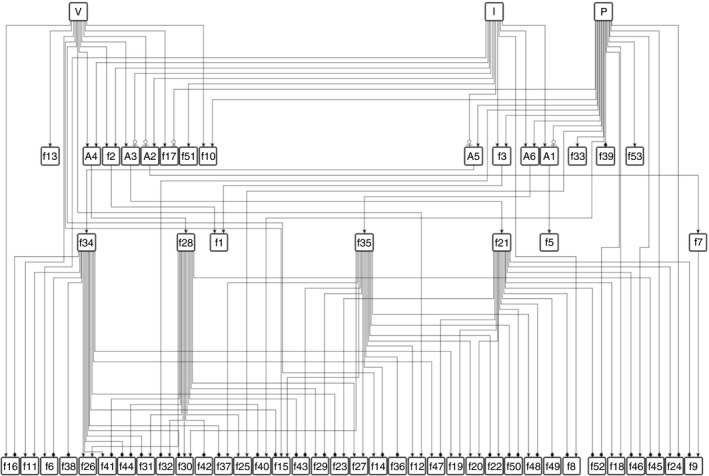
 : up‐regulation,
  : inhibition and
  : down‐regulation.
References
-
- Platanias LC. Mechanisms of type‐I‐ and type‐II‐interferon‐mediated signalling. Nat Rev Immunol 2005; 5:375–86. - PubMed
-
- Shuai K, Liu B. Regulation of JAK‐STAT signalling in the immune system. Nat Rev Immunol 2003; 3:900–11. - PubMed
-
- Ashkar AA, Croy BA. Interferon‐γ contributes to the normalcy of murine pregnancy. Biol Reprod 1999; 61:493–502. - PubMed
-
- Mattsson R, Mattsson A, Holmdahl R, Scheynius A, Van der Meide PH. In vivo treatment with interferon‐gamma during early pregnancy in mice induces strong expression of major histocompatibility complex class I and II molecules in uterus and decidua but not in extra‐embryonic tissues. Biol Reprod 1992; 46:1176–86. - PubMed
Publication types
MeSH terms
Substances
Grants and funding
LinkOut - more resources
Full Text Sources
Other Literature Sources
