. 2017 Jan 5;8(1):e2537.
doi: 10.1038/cddis.2016.453.

Dysfunctional autophagy in RPE, a contributing factor in age-related macular degeneration

Affiliations

Dysfunctional autophagy in RPE, a contributing factor in age-related macular degeneration

Nady Golestaneh et al. Cell Death Dis. .

Abstract

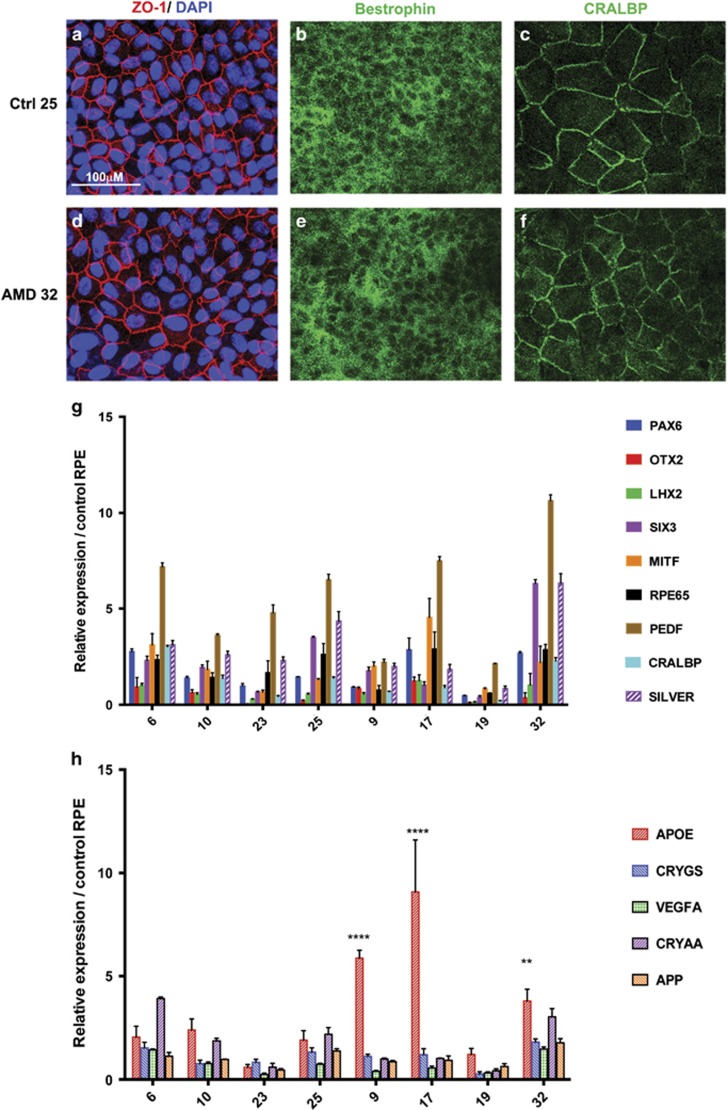
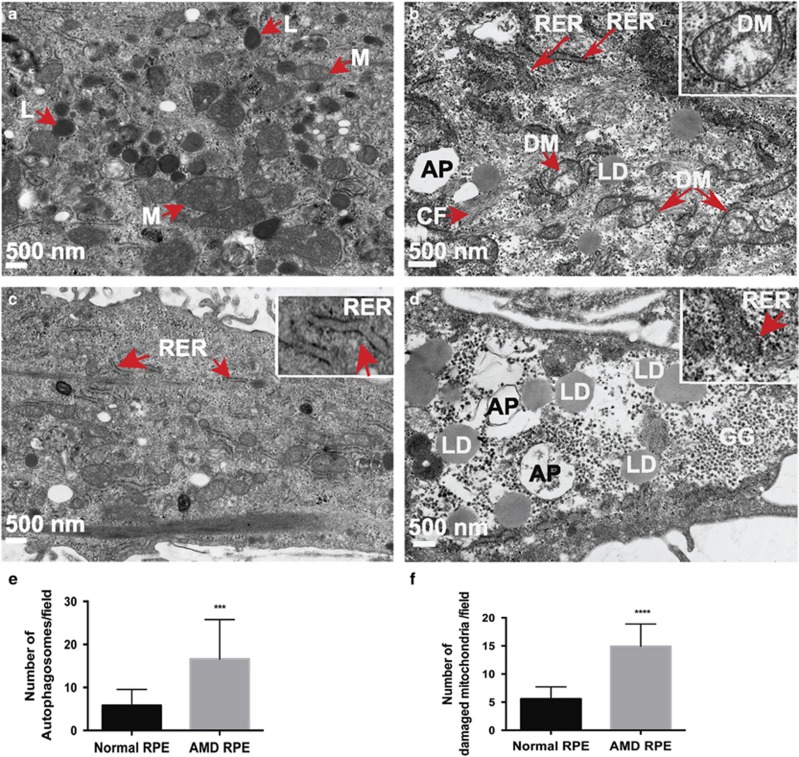
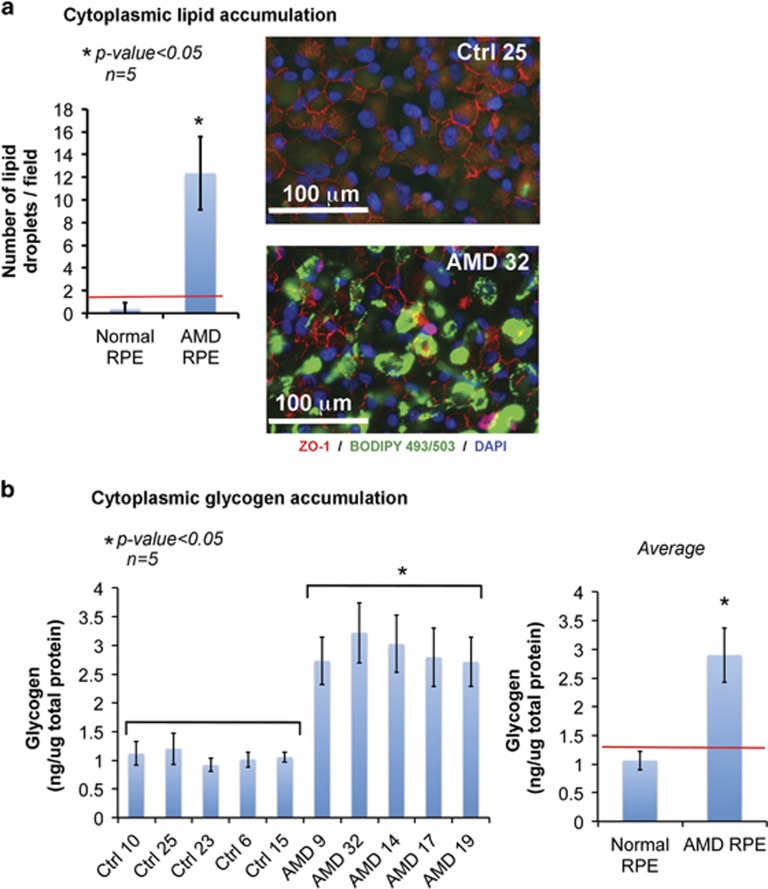
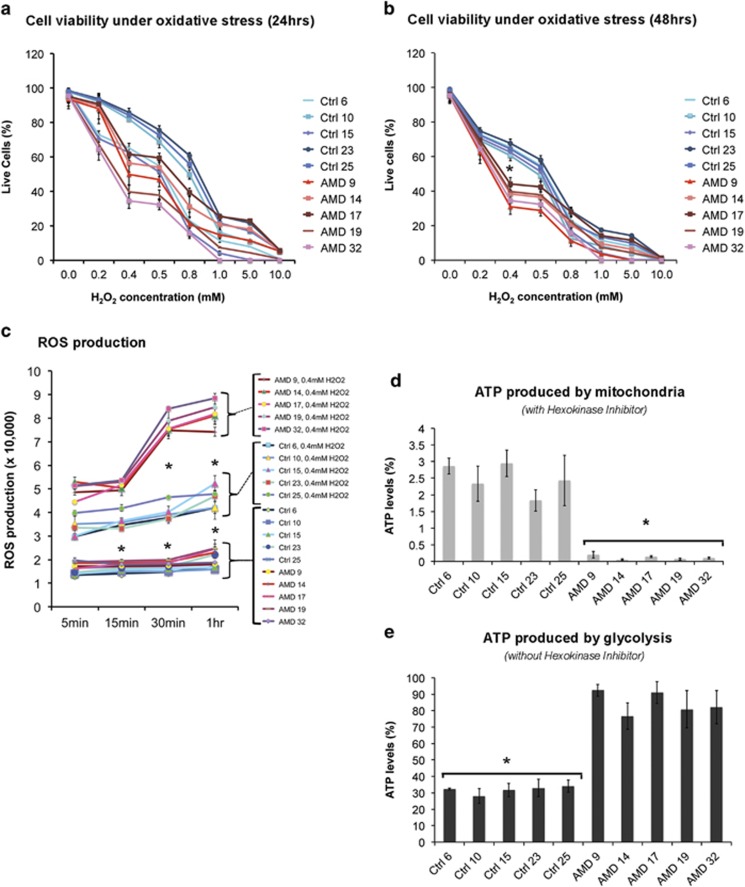
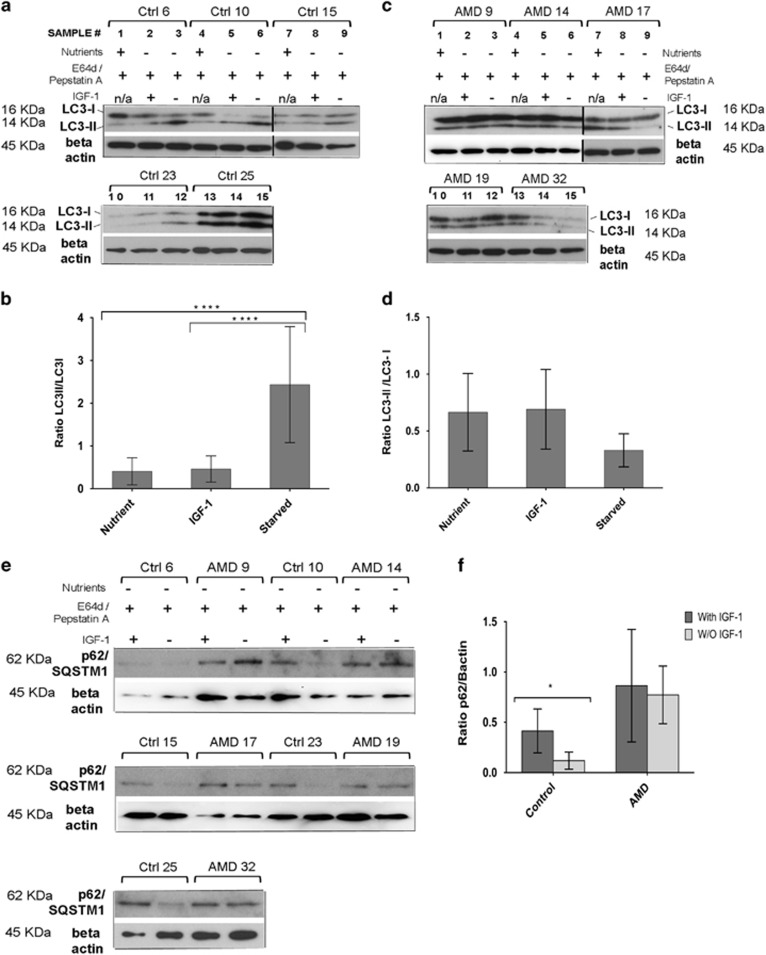
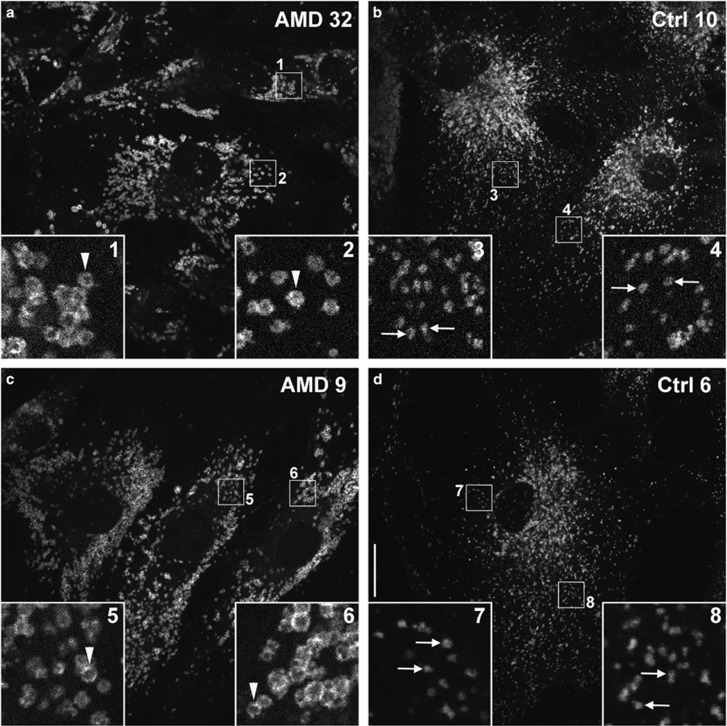
Age-related macular degeneration (AMD) is a devastating neurodegenerative disease and a major cause of blindness in the developed world. Owing to its complexity and the lack of an adequate human model that recapitulates key aspects of the disease, the molecular mechanisms of AMD pathogenesis remain poorly understood. Here we show that cultured human retinal pigment epithelium (RPE) from AMD donors (AMD RPE) are functionally impaired and exhibit distinct phenotypes compared with RPE cultured from normal donors (normal RPE). Accumulation of lipid droplets and glycogen granules, disintegration of mitochondria, and an increase in autophagosomes were observed in AMD RPE cultures. Compared with normal RPE, AMD RPE exhibit increased susceptibility to oxidative stress, produce higher levels of reactive oxygen species (ROS) under stress conditions, and showed reduced mitochondrial activity. Measurement of the ratio of LC3-II/ LC3-I, revealed impaired autophagy in AMD RPE as compared with normal RPE. Autophagic flux was also reduced in AMD RPE as compared with normal RPE, as shown by inability of AMD RPE to downregulate p62 levels during starvation. Impaired autophagic pathways were further shown by analyzing late autophagic vesicles; immunostaining with lysosome-associated membrane protein 1 (LAMP-1) antibody revealed enlarged and annular LAMP-1-positive organelles in AMD RPE as opposed to smaller discrete puncta observed in normal RPE. Our study provides insights into AMD cellular and molecular mechanisms, proposes dysfunctional autophagy as an underlying mechanism contributing to the pathophysiology of the disease, and opens up new avenues for development of novel treatment strategies.


Conflict of interest statement

The authors declare no conflict of interest.

Figures

Figure 1
Figure 1
(a-f) Isolation and characterization of RPE from donors. The isolated RPE from AMD and control donors express RPE-specific proteins ZO-1, Bestrophin and CRALBP. A representative image of immunostaining is shown for each group. Bar represents 100 μM. (g) Gene expression analysis by qRT-PCR confirming the expression of RPE marker genes in the RPE isolated from donors (controls 6, 10, 23 and 25; AMD 9, 17, 19 and 32). (h) Gene expression analysis of AMD-associated genes in AMD and normal RPE. **P<0.01, ****P<0.0001
Figure 2
Figure 2
AMD RPE exhibit disease phenotypes. (a-d) EM images of normal 10 (a and c) and AMD 9 (b and d) RPE showing disease phenotypes. Red arrows indicate the observed morphological differences. Higher magnification insets show the observed phenotypes (in b and d), in comparison with the normal cellular structures (in c). L, lysosomes; M, mitochondria; RER, rough ER; LD, lipid droplets; F, cytoskeletal fascicles. (e and f) Number of APs and damaged mitochondria were counted (n=3) in four random regions per cell. The images used for counting were all the same size and same magnification. The mean±S.D. and the P-values were calculated for statistical significance. P-value equals 0.0002 (***) and 0.0001 (****) for (e and f), respectively
Figure 3
Figure 3
Lipid and glycogen accumulation in AMD RPE. (a) (Left): graph showing the quantification of lipid droplets in normal and AMD RPE, as determined by counting the lipid droplets in three random fields of stained images (shown in right panel), in the five normal and five AMD RPE (n=5). Asterisk (*) indicates statistically significant difference in number of lipid droplets between control and AMD RPE. (a) (Right): analysis of cytoplasmic lipid by fluorescence staining in control and AMD RPE, showing higher intensity of lipid staining in the AMD RPE. (b) (Left): measurement of glycogen accumulation by colorimetric assay showing statistically significant higher concentration in the AMD RPE compared with control RPE (n=5). (b) (Right): graph of the average glycogen concentrations calculated from five normal and five AMD RPE shown in the left graph. Red line indicates the threshold that separates AMD and normal RPE. Asterisk (*) indicates statistically significant differences in glycogen concentrations between the AMD and control RPE. P-values in (a and b) are determined by ANOVA followed by Tukey's test, with P<0.05
Figure 4
Figure 4
AMD RPE are more susceptible to oxidative stress and show lower mitochondrial activity. (a and b) Cell viability assays of AMD and control RPE treated with increasing concentrations of H2O2 for 24 h (a) and 48 h (b). Higher susceptibility of the AMD RPE under oxidative stress conditions is observed in 48 h. (c) ROS production under stress is significantly higher in AMD RPE. (d and e) AMD RPE have significantly lower mitochondrial activity, as indicated by their ATP levels measured by a luminescence assay in the presence of hexokinase inhibitor. (d) ATP levels produced by mitochondria are significantly lower in AMD RPE as measured in the presence of hexokinase inhibitor. (e) ATP levels produced by glycolysis are higher in AMD RPE as measured in the absence of hexokinase inhibitor. The difference in ATP levels measured in the presence (d) and absence (e) of hexokinase inhibitor show glycolysis as the major source of ATP production in AMD RPE. Asterisks (*) indicate statistical significance, determined by the ANOVA analysis followed by Tukey's test (P-value<0.05, n=5 for each sample)
Figure 5
Figure 5
Autophagy is dysfunctional in AMD RPE. (a and c) Analysis of autophagy dynamics in normal RPE (a), and AMD RPE (c), n=5. LC3 immunoblots of control and AMD RPE under three different conditions, nutrient, starvation in the presence of IGF-1, and starvation in the absence of IGF-1 are shown. Beta actin is used as a normalization control. Spliced membranes are indicated by the vertical lines. (b and d) The ratios of the LC3-II/LC3-I levels as determined by densitometry are illustrated in the graphs, showing that an increase in autophagy dynamics in the absence of IGF-1 under starvation conditions is observed only in normal, but not in AMD RPE. Densitometry was performed on three repeats of the experiment for each sample in five normal and five AMD RPE (b and d). Asterisks in (b) represent P-value <0.0001 of LC3-II/LC3-I ratios as determined by one-way Anova followed by Tukey's test. (e and f) Autophagic flux is lower in AMD RPE as compared with normal RPE. (e) Immunoblot of p62, demonstrating lower autophagic flux in AMD RPE as shown by inability of AMD RPE to downregulate p62 levels during starvation in the absence of IGF-1. Beta actin is used as a normalization control. (f) Relative expression of p62 in control and AMD RPE in the presence and absence of IGF-1, as determined by densitometry analysis of the immunoblot in (e), n=5. The asterisks (*) indicate statistical significance determined by ANOVA followed by Tukey's test (P<0.05)
Figure 6
Figure 6
Autophagolysosomes are swollen in AMD RPE. Swollen LAMP-1-positive organelles, commonly indicative of defective lysosomal function, are consistently observed in AMD RPE (white arrowheads, AMD 32 (a) and AMD 9 (c)), but not in healthy RPE (white arrows, Ctrl 10 (b) and Ctrl 6 (d)). Insets (1–8) are × 5 magnifications of indicated boxed regions, scale bar represents 20 μm

References

    1. Klein R, Chou CF, Klein BE, Zhang X, Meuer SM, Saaddine JB. Prevalence of age-related macular degeneration in the US population. Arch Ophthalmol 2011; 129: 75–80. - PubMed
    1. Gehrs KM, Anderson DH, Johnson LV, Hageman GS. Age-related macular degeneration—emerging pathogenetic and therapeutic concepts. Ann Med 2006; 38: 450–471. - PMC - PubMed
    1. Rein DB, Wittenborn JS, Zhang X, Honeycutt AA, Lesesne SB, Saaddine J. Forecasting age-related macular degeneration through the year 2050: the potential impact of new treatments. Arch Ophthalmol 2009; 127: 533–540. - PubMed
    1. Boulton M, Dayhaw-Barker P. The role of the retinal pigment epithelium: topographical variation and ageing changes. Eye (Lond) 2001; 15(Pt 3): 384–389. - PubMed
    1. Nowak JZ. Age-related macular degeneration (AMD): pathogenesis and therapy. Pharmacol Rep 2006; 58: 353–363. - PubMed

Publication types

MeSH terms