

A combination of long term fragmentation and glacial persistence drove the evolutionary history of the Italian wall lizard Podarcis siculus
- PMID: 28056768
- PMCID: PMC5216540
- DOI: 10.1186/s12862-016-0847-1
A combination of long term fragmentation and glacial persistence drove the evolutionary history of the Italian wall lizard Podarcis siculus
Abstract
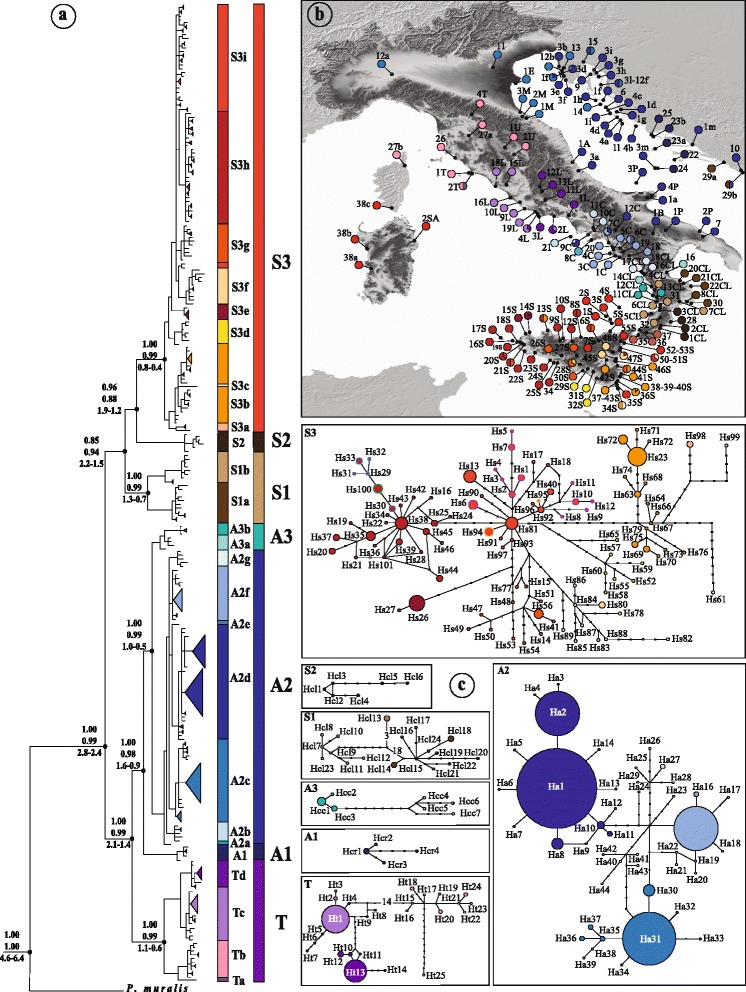
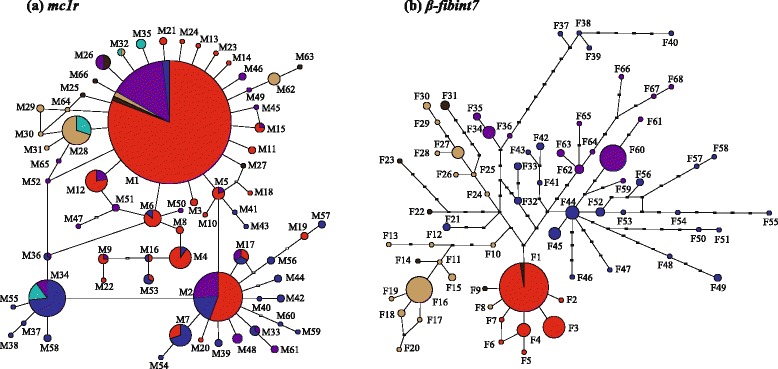
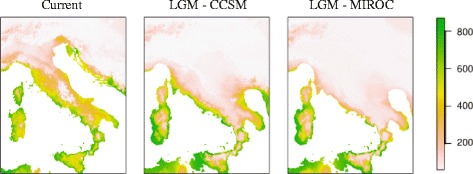
Background: The current distribution of genetic diversity is the result of a vast array of microevolutionary processes, including short-term demographic and ecological mechanisms and long-term allopatric isolation in response to Quaternary climatic fluctuations. We investigated past processes that drove the population differentiation and spatial genetic distribution of the Italian wall lizard Podarcis siculus by means of sequences of mitochondrial cytb (n = 277 from 115 localities) and nuclear mc1r and β-fibint7genes (n = 262 and n = 91, respectively) from all its distribution range. The pattern emerging from the genetic data was compared with current and past (last glacial maximum) species distribution modeling (SDM).
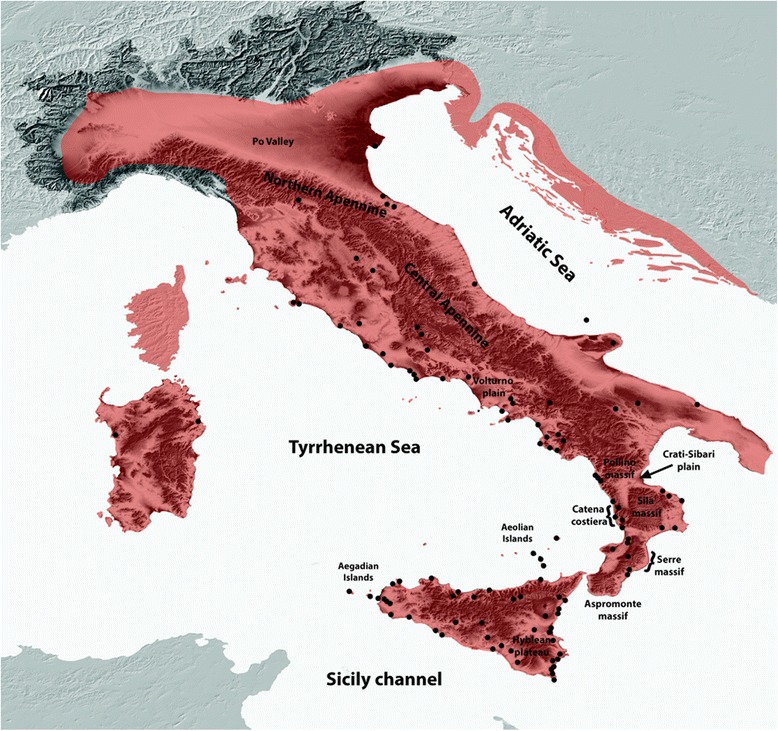
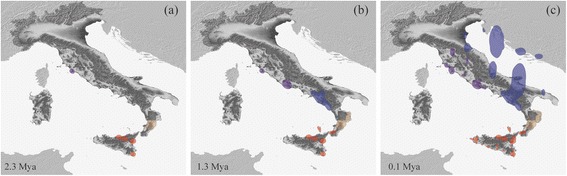
Results: We identified seven deeply divergent parapatric clades which presumably remained isolated in different refugia scattered mainly throughout the Tyrrhenian coast. Conversely, the Adriatic coast showed only two haplogroups with low genetic variability. These results appear to agree with the SDM prediction at the last glacial maximum (LGM) indicating a narrow area of habitat suitability along the Tyrrhenian coast and much lower suitability along the Adriatic one. However, the considerable land exposure of the Adriatic coastline favored a glacial colonization of the Balkan Peninsula.
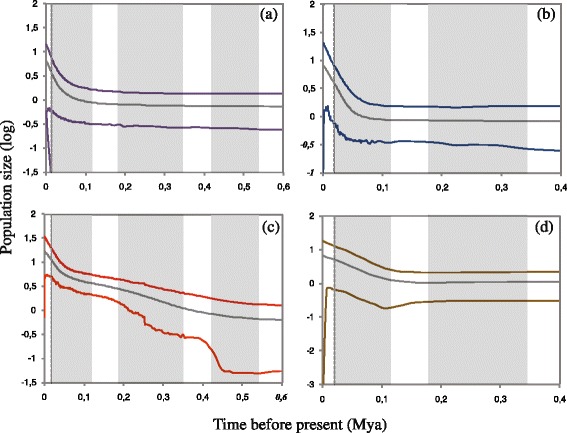
Conclusions: Our population-level historical demography showed a common trend consistent with glacial expansions and regional persistence during the last glacial maximum. This complex genetic signature appears to be inconsistent with the expectation of the expansion-contraction model and post-LGM (re)colonizations from southern refugia. Hence it is one of an increasing number of cases in which these assumptions are not met, indicating that long-term fragmentation and pre-LGM events such as glacial persistence were more prominent in shaping genetic variation in this temperate species.
Keywords: Evolutionary history; Glacial expansion; Italian wall lizard; Niche modelling; Phylogeography; Podarcis siculus.
Figures
Similar articles
-
Persistence across Pleistocene ice ages in Mediterranean and extra-Mediterranean refugia: phylogeographic insights from the common wall lizard.BMC Evol Biol. 2013 Jul 11;13:147. doi: 10.1186/1471-2148-13-147. BMC Evol Biol. 2013. PMID: 23841475 Free PMC article.
-
Evolutionary history of the Maltese wall lizard Podarcis filfolensis: insights on the ‘Expansion–Contraction’ model of Pleistocene biogeography.Mol Ecol. 2014 Mar;23(5):1167-87. doi: 10.1111/mec.12668. Mol Ecol. 2014. PMID: 24716210
-
Phylogeography and ecological niche modeling unravel the evolutionary history of the Yarkand hare, Lepus yarkandensis (Mammalia: Leporidae), through the Quaternary.BMC Evol Biol. 2019 Jun 1;19(1):113. doi: 10.1186/s12862-019-1426-z. BMC Evol Biol. 2019. PMID: 31153378 Free PMC article.
-
Evaluating signatures of glacial refugia for North Atlantic benthic marine taxa.Ecology. 2008 Nov;89(11 Suppl):S108-22. doi: 10.1890/08-0257.1. Ecology. 2008. PMID: 19097488 Review.
-
Climate refugia: joint inference from fossil records, species distribution models and phylogeography.New Phytol. 2014 Oct;204(1):37-54. doi: 10.1111/nph.12929. Epub 2014 Jul 16. New Phytol. 2014. PMID: 25039238 Review.
Cited by
-
De Novo Transcriptome Assembly and Population Genetic Analyses for an Endangered Chinese Endemic Acer miaotaiense (Aceraceae).Genes (Basel). 2018 Jul 27;9(8):378. doi: 10.3390/genes9080378. Genes (Basel). 2018. PMID: 30060522 Free PMC article.
-
Niche diversification of Mediterranean and southwestern Asian tortoises.PeerJ. 2022 Jul 11;10:e13702. doi: 10.7717/peerj.13702. eCollection 2022. PeerJ. 2022. PMID: 35846890 Free PMC article.
-
Patterns of variations in dorsal colouration of the Italian wall lizard Podarcis siculus.Biol Open. 2021 Oct 15;10(10):bio058793. doi: 10.1242/bio.058793. Epub 2021 Oct 6. Biol Open. 2021. PMID: 34447997 Free PMC article.
-
Reproductive Traits and Hatchling Characteristics of the Endemic Sardinian Grass Snake (Natrix helvetica cetti): First Field Data, with Screening for Ophidiomyces ophidiicola.Animals (Basel). 2025 Feb 3;15(3):418. doi: 10.3390/ani15030418. Animals (Basel). 2025. PMID: 39943188 Free PMC article.
-
The European Pine Marten Martes martes (Linnaeus, 1758) Is Autochthonous in Sicily and Constitutes a Well-Characterised Major Phylogroup within the Species (Carnivora, Mustelidae).Animals (Basel). 2022 Sep 23;12(19):2546. doi: 10.3390/ani12192546. Animals (Basel). 2022. PMID: 36230287 Free PMC article.
References
-
- Hewitt GM. Some genetic consequences of ice ages and their role in divergence and speciation. Biol J Linn Soc. 1996;58:247–276. doi: 10.1006/bijl.1996.0035. - DOI
MeSH terms
Substances
LinkOut - more resources
Full Text Sources
Other Literature Sources
Miscellaneous
