

Translational control of lipogenic enzymes in the cell cycle of synchronous, growing yeast cells
- PMID: 28057705
- PMCID: PMC5694946
- DOI: 10.15252/embj.201695050
Translational control of lipogenic enzymes in the cell cycle of synchronous, growing yeast cells
Abstract
Translational control during cell division determines when cells start a new cell cycle, how fast they complete it, the number of successive divisions, and how cells coordinate proliferation with available nutrients. The translational efficiencies of mRNAs in cells progressing synchronously through the mitotic cell cycle, while preserving the coupling of cell division with cell growth, remain uninvestigated. We now report comprehensive ribosome profiling of a yeast cell size series from the time of cell birth, to identify mRNAs under periodic translational control. The data reveal coordinate translational activation of mRNAs encoding lipogenic enzymes late in the cell cycle including Acc1p, the rate-limiting enzyme acetyl-CoA carboxylase. An upstream open reading frame (uORF) confers the translational control of ACC1 and adjusts Acc1p protein levels in different nutrients. The ACC1 uORF is relevant for cell division because its ablation delays cell cycle progression, reduces cell size, and suppresses the replicative longevity of cells lacking the Sch9p protein kinase regulator of ribosome biogenesis. These findings establish an unexpected relationship between lipogenesis and protein synthesis in mitotic cell divisions.
Keywords: ACC1; cell size; mitosis; translation; upstream open reading frame.
© 2017 The Authors.
Figures
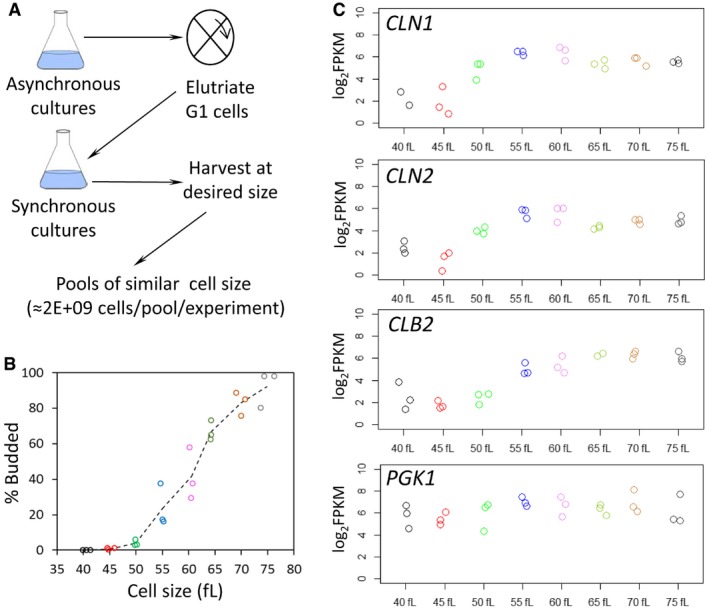
Schematic overview of our approach.
From the individual pools of Saccharomyces cerevisiae cells we used for ribosome profiling, the weighted average of the cell size of each pool is shown on the x‐axis (in fl) and their corresponding budding index on the y‐axis (% Budded). Pools of similar cell size are indicated with the same color.
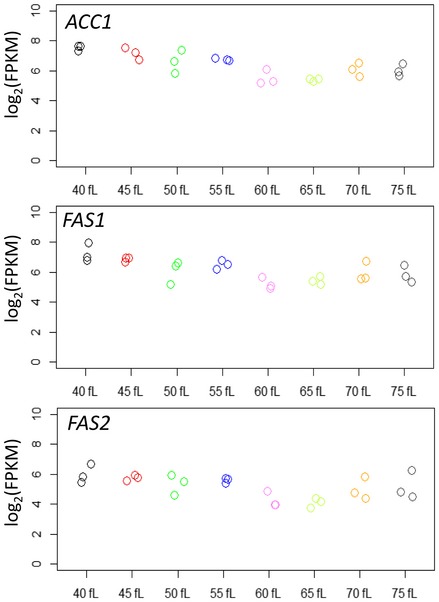
The log2‐transformed normalized (FPKMs) reads of representative transcripts that peak at G1/S (cyclins CLN1 and CLN2), G2 (cyclin CLB2), or are constitutively expressed (PGK1), are shown for each cell size pool.
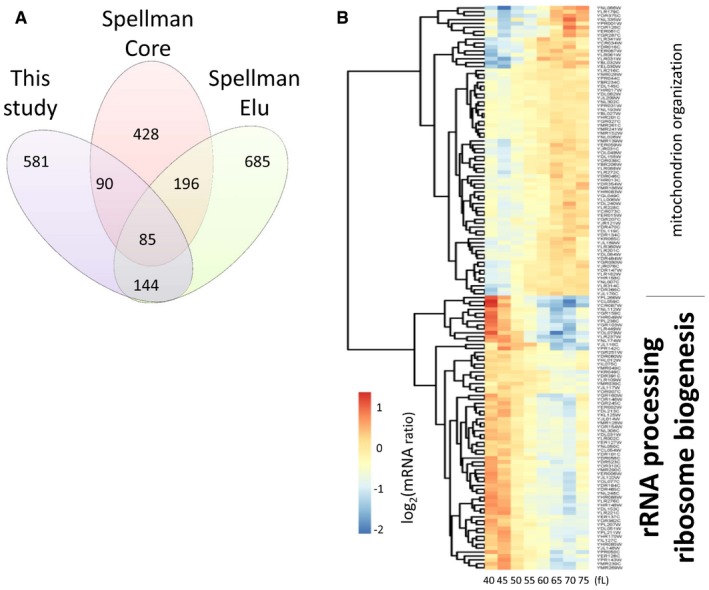
Venn diagram showing the number of cell cycle‐regulated transcripts in the following datasets: The “Spellman Core” dataset was defined by Spellman et al (1998), based on an “aggregate CDC score” from multiple experiments that did not include the elutriation dataset that Spellman and colleagues performed (Spellman et al, 1998). The “Spellman Elu” dataset includes all the cell cycle‐regulated transcripts we identified by analyzing the microarray elutriation experiment of Spellman et al (1998), as we described in the Materials and Methods. Our dataset (Dataset 1 within the Source Data for this figure), “This study”, from the elutriations shown in Fig 1 was analyzed exactly as the “Spellman Elu” set.
Heatmap of the mRNA levels of the 144 genes (Dataset 2 within the Source Data for this figure) in common between the “Spellman Elu” and “This study” datasets. The enriched Gene Ontology terms highlighted on top (P = 0.001), or bottom (P = 6.0E‐23), were calculated with the DAVID software tool (Huang et al, 2007), or the YeastMine platform (Balakrishnan et al, 2012), respectively.
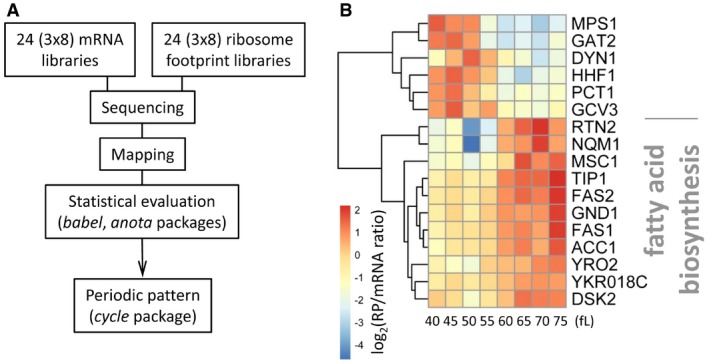
Schematic of the workflow that identified 17 mRNAs under periodic translational control (see Materials and Methods). Datasets 3 and 4 within the Source Data for this figure are the input data for the mRNA and ribosome footprints used for the babel package, while Dataset 6 (within the Source Data for this figure) was used as input for the anota package. Datasets 5 and 7 (within the Source Data for this figure) were the output of the babel and anota packages, respectively. Dataset 8 (within the Source Data for this figure) is the set of genes identified in common by the babel and anota packages.
Heatmap of the 17 mRNAs under periodic translational control in synchronous elutriated cultures of wild‐type, diploid cells (BY4743 background). The data were hierarchically clustered and displayed with the pheatmap R package, as described in Materials and Methods and in Fig 2. The enriched (P = 7.6E‐5) Gene Ontology term highlighted was calculated with Holm–Bonferroni test correction, from the YeastMine platform (Balakrishnan et al, 2012).
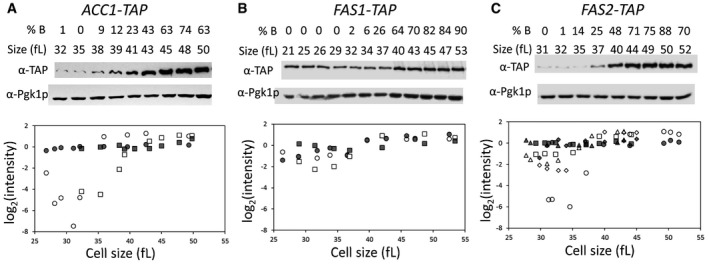
- A–C
Early G1 daughter cells of cells carrying C‐terminal TAP‐tagged alleles of ACC1 (A), FAS1 (B), or FAS2 (C) at their endogenous chromosomal locations were collected by elutriation and allowed to progress synchronously in the cell cycle. At the indicated cell sizes (fl) and budding index (% B), the abundance of the proteins shown was queried by immunoblotting (see Materials and Methods). Representative images of the immunoblots are shown on top, with the cells size (in fl) and the percentage of budded cells (% B) shown in each case. The graphs at the bottom display the band intensities for each independent experiment (indicated with different open symbols; see Source Data for the corresponding immunoblots), plotted on the y‐axis as the log2 values of their expressed ratios (see Materials and Methods), against the corresponding cell size (x‐axis). Experiment‐matched loading controls (filled symbols) were also quantified and shown in parallel.
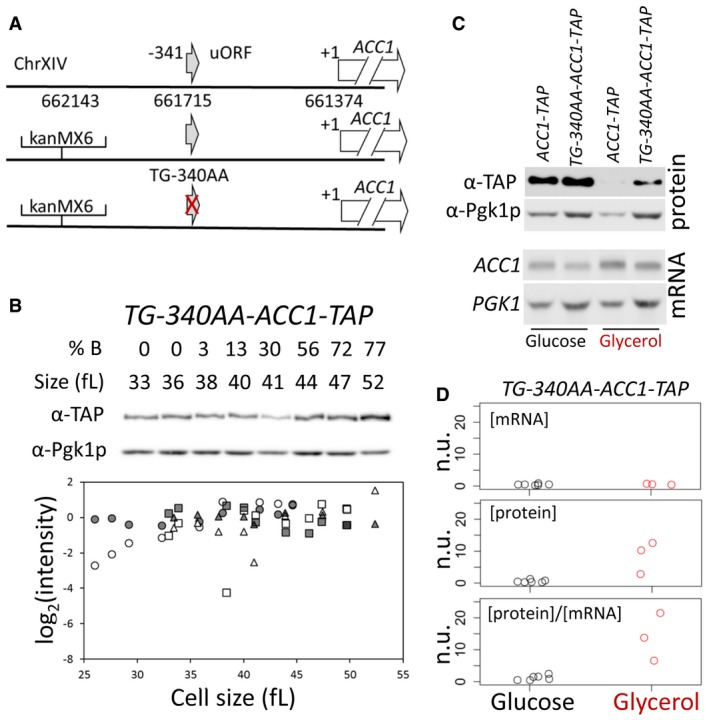
Schematic of the modifications we introduced to test the role of the uORF present 340 nucleotides upstream of the main ACC1 ORF. The red cross indicates the ablation of the uORF.
The abundance of Acc1p‐TAP was monitored in a strain that lacks the ACC1 uORF (TG‐340AA‐ACC1‐TAP), constructed as described in Materials and Methods. Samples were collected by elutriation and allowed to progress synchronously in the cell cycle, exactly as described in Fig 4. The corresponding mRNA levels are shown in Fig EV2. Experiment‐matched loading controls (filled symbols) were also quantified and shown in parallel.
Steady‐state ACC1 mRNA and Acc1p protein levels were measured in rich undefined media, differing in the carbon source (2% glucose or 3% glycerol) from the indicated strains carrying C‐terminal TAP‐tagged alleles of ACC1 at their endogenous chromosomal locations.
Strip charts depicting the relative abundance of ACC1 mRNA and protein from cells that lack the ACC1 uORF (TG‐340AA‐ACC1‐TAP), quantified from independent experiments done as in (C). To obtain the normalized units (n.u.) on the y‐axis, we first normalized for loading against the corresponding PGK1 and Pgk1p values from the same samples. We then expressed these values as ratios against the corresponding values of wild‐type ACC1‐TAP cells, in which the ACC1 uORF is in place, from experiments run and analyzed in parallel.
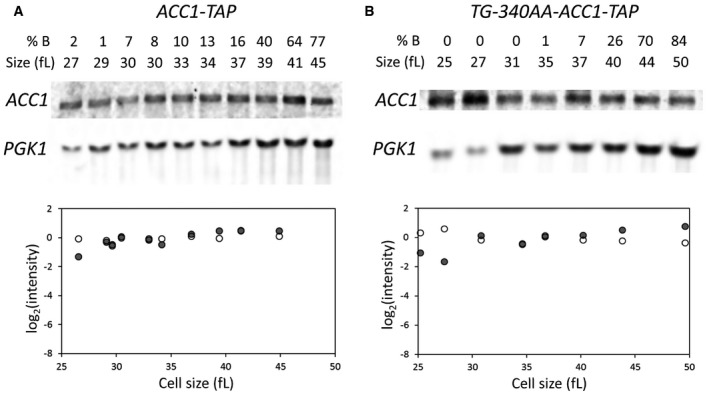
- A, B
Samples were collected by elutriation and allowed to progress synchronously in the cell cycle. At the indicated cell sizes, the abundance of the indicated mRNAs was queried and quantified as described in Materials and Methods.
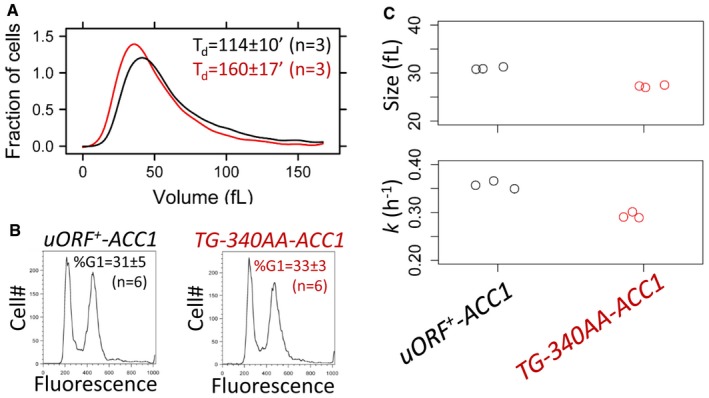
Representative size histograms of the wild‐type (shown in black) and TG‐340AA‐ACC1 (shown in red) cell populations cultured in YPGlycerol medium was measured using a channelyzer. Cell numbers are plotted on the y‐axis, and the x‐axis indicates cell volume (in fl). The average doubling time (T d) of the same cultures (n = 3) is shown in each case (average ± s.d.).
Representative DNA content histograms of wild‐type (shown in black) and TG‐340AA‐ACC1 (shown in red) cell populations cultured in YPGlycerol were obtained with flow cytometry. Cell numbers are plotted on the y‐axis, and the x‐axis indicates fluorescence per cell. The average percentage of cells with a G1 DNA content (%G1) of the same samples (n = 6) is shown in each case (average ± s.d.).
Strip charts showing the critical size (top) and specific rate of size increase (bottom) of the indicated strains obtained from elutriated synchronous cell populations growing in YPGlycerol medium.
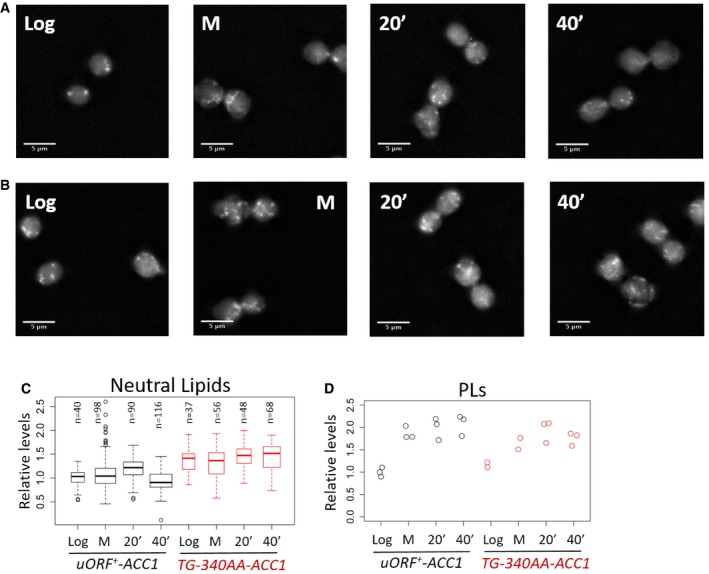
Representative images to visualize neutral lipids using fluorescence microscopy of wild‐type (uORF + ‐ACC1) cells stained with Nile Red as described in Materials and Methods. The images were taken from cells grown in rich, glucose‐containing medium at the following states: proliferating exponentially (Log); arrested in mitosis with nocodazole (M); and 20 or 40 min after they were released from the arrest (20′ or 40′).
Images of ACC1 uORF mutant cells (TG‐340AA‐ACC1), obtained as in (A).
Quantification of the lipid droplet (Neutral Lipids) staining from (A and B), displayed with box‐plots, normalized for the values of the “Log uORF + ‐ACC1” sample. The median and the inter‐quartile range are indicated, along with the number of cells examined in each case. The whiskers extend to 1.5 times the interquartile range.
Strip charts showing the quantification of total phospholipid (PLs) content from the same cell populations shown in (A–C), normalized for the values of the “Log uORF + ‐ACC1” sample.
- A, B
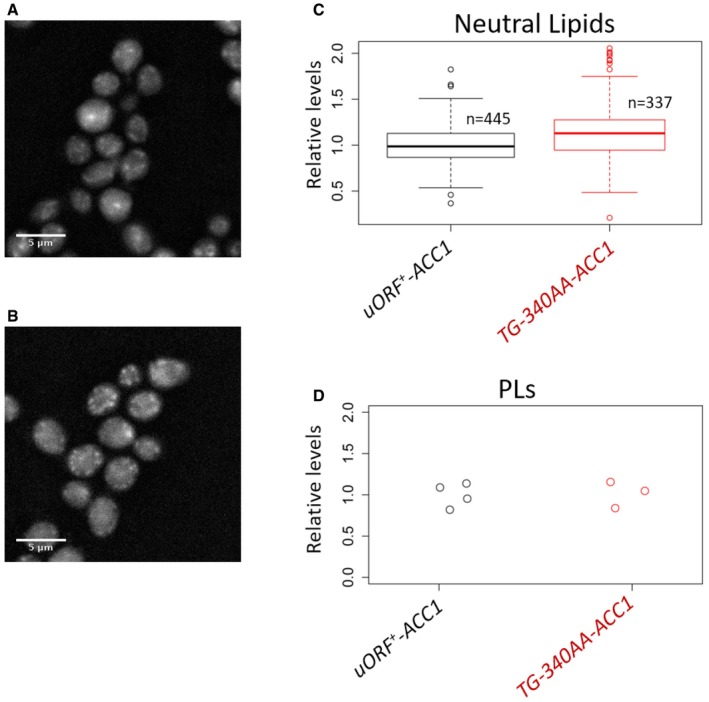
Representative images to visualize lipid droplets using fluorescence microscopy of wild‐type (A) or ACC1 uORF mutant cells (B) proliferating exponentially in poor medium, with glycerol as carbon source. In all microscope images, 5 μm scale bars are indicated.
- C
Quantification of the lipid droplet (Neutral Lipids) staining from (A and B), displayed with box‐plots, normalized for the values of the “uORF + ‐ACC1” sample. The median and the inter‐quartile range are indicated, along with the number of cells examined in each case. The whiskers extend to 1.5 times the interquartile range.
- D
Strip chart showing the quantification of total phospholipid (PLs) content from the same cell populations shown in (A–C), normalized for the values of the “uORF + ‐ACC1” sample.
- A, B
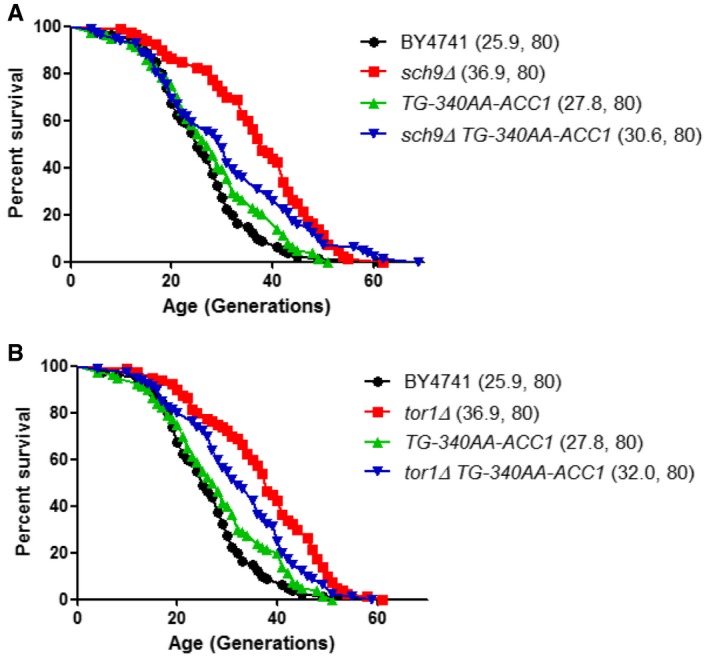
Survival curves in the MATa BY4741 background of the indicated strains lacking SCH9 (A) or TOR1 (B), alone or in combination with the ACC1 uORF mutation (TG‐340AA‐ACC1). Mean life spans are shown in parentheses, along with the number of cells assayed in each case.
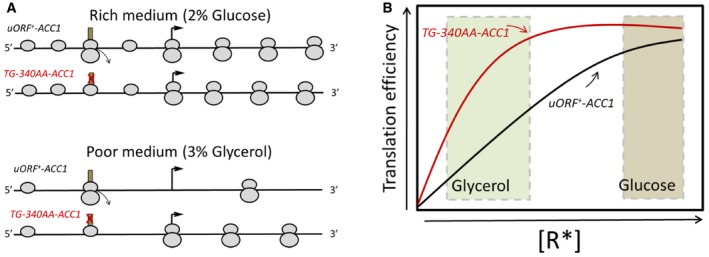
Top: In rich media with high ribosome content, the uORF does not significantly inhibit the number of scanning ribosomes that initiate from the main ACC1 ORF. Bottom: In poor media with lower ribosome content, the uORF reduces the number of scanning ribosomes that are able to reach the main, downstream AUG, thereby disproportionately reducing Acc1p synthesis.
The expected translational efficiency of the wild‐type ACC1 mRNA (shown in black) and the mutant lacking the uORF (shown in red) is depicted as a function of the concentration of active initiating ribosomes, R*, in the cell, adapted from the standard theoretical calculations of Lodish (1974).
References
-
- Bloom J, Cross FR (2007) Multiple levels of cyclin specificity in cell‐cycle control. Nat Rev Mol Cell Biol 8: 149–160 - PubMed
-
- Bogomolnaya LM, Pathak R, Cham R, Guo J, Surovtseva YV, Jaeckel L, Polymenis M (2004) A new enrichment approach identifies genes that alter cell cycle progression in Saccharomyces cerevisiae . Curr Genet 45: 350–359 - PubMed
Publication types
MeSH terms
Substances
Grants and funding
LinkOut - more resources
Full Text Sources
Other Literature Sources
Molecular Biology Databases
Miscellaneous
