. 2017 Feb 20;474(5):731-749.
doi: 10.1042/BCJ20160679.

Calcium-mediated oxidative stress: a common mechanism in tight junction disruption by different types of cellular stress

Affiliations

Calcium-mediated oxidative stress: a common mechanism in tight junction disruption by different types of cellular stress

Ruchika Gangwar et al. Biochem J. .

Abstract

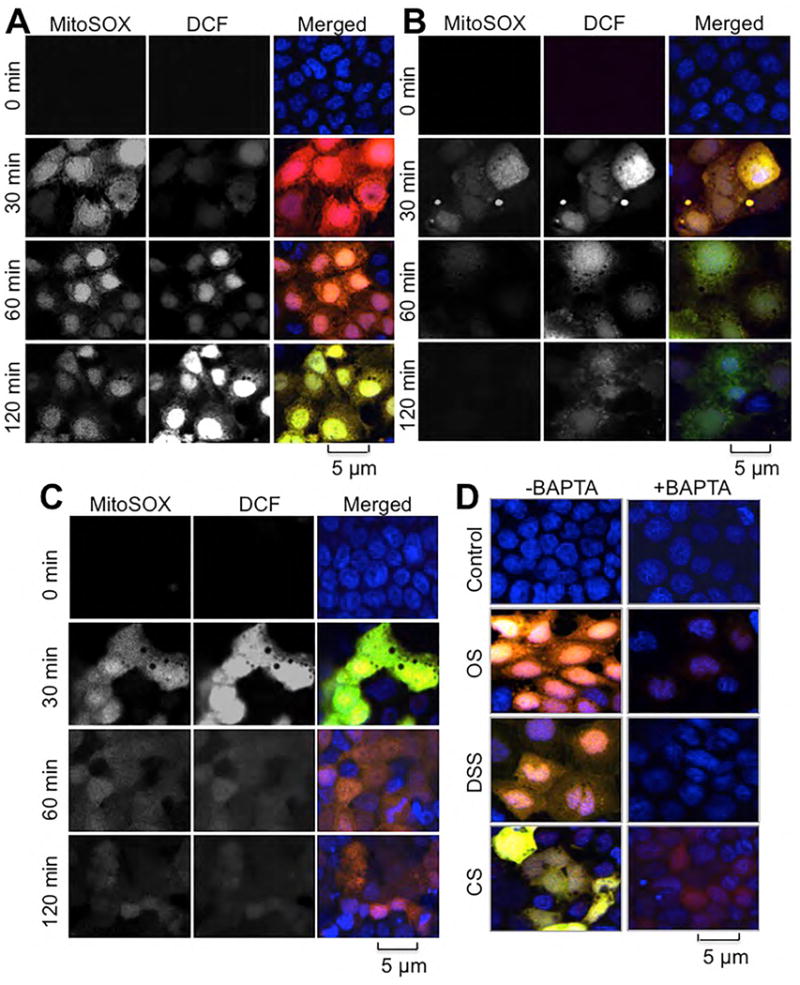
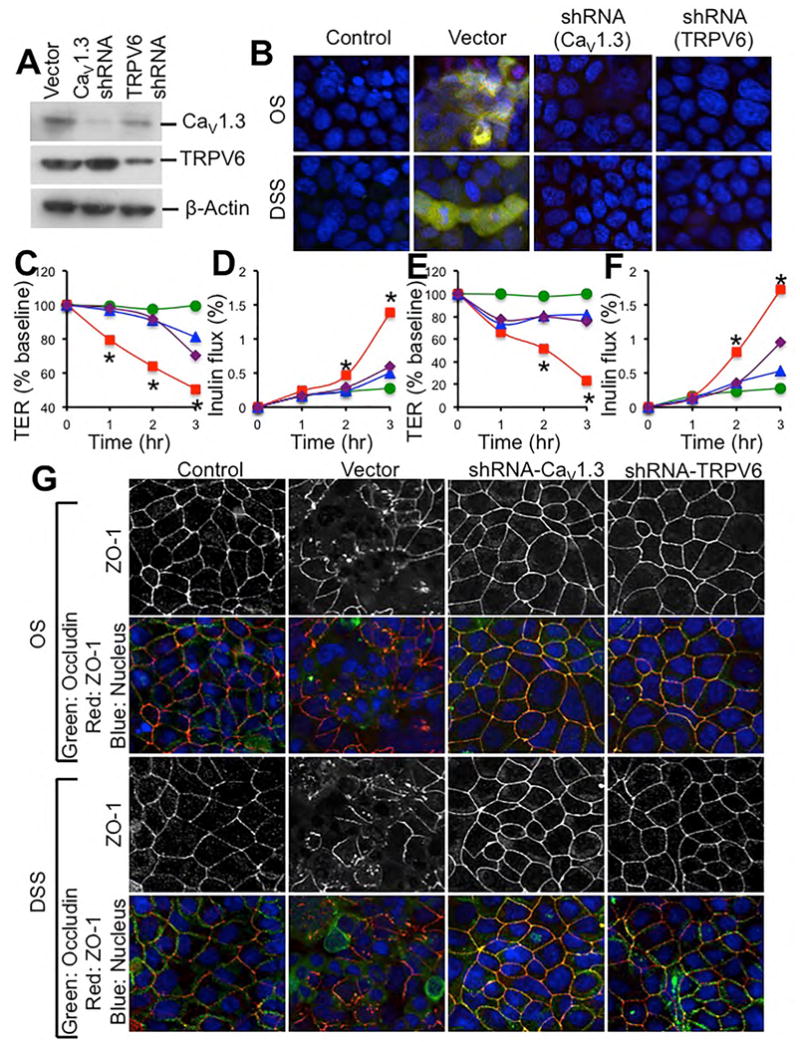
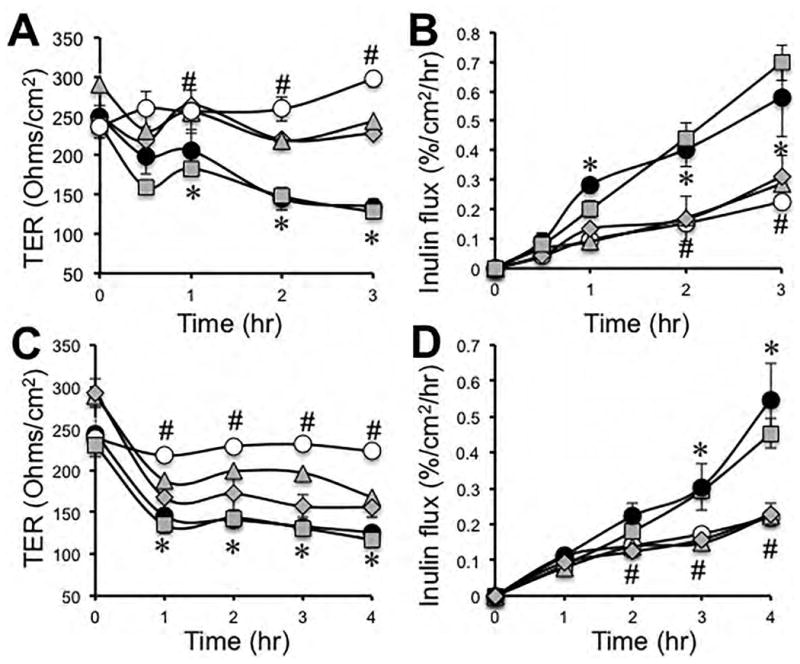
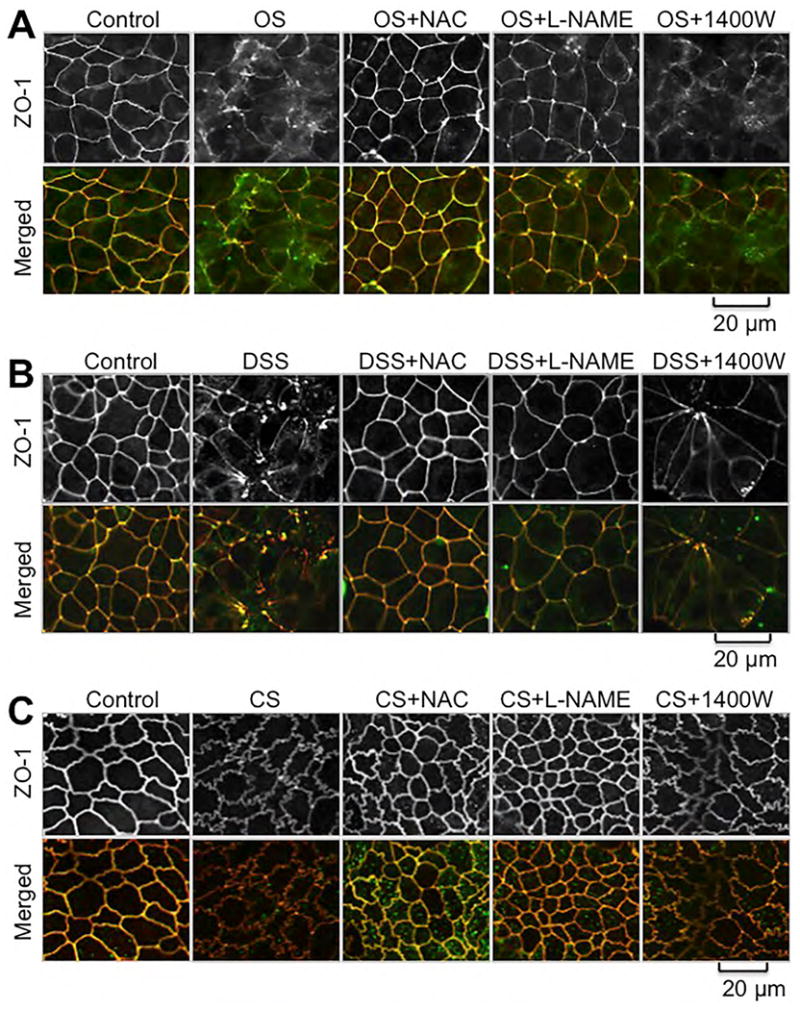
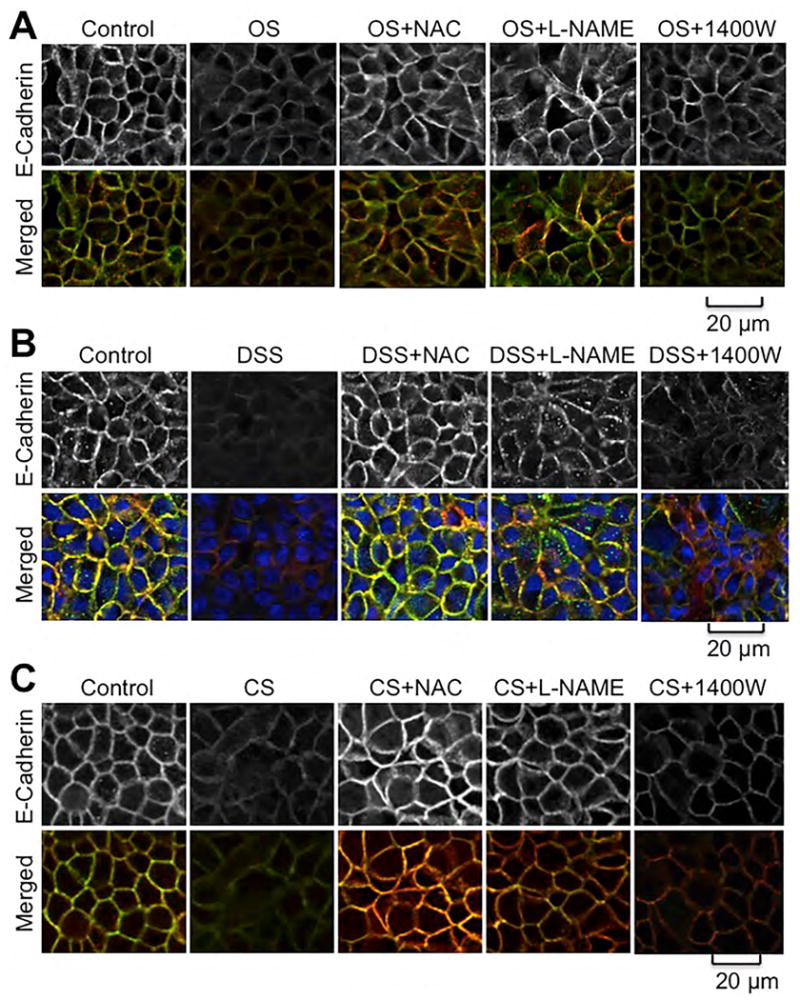
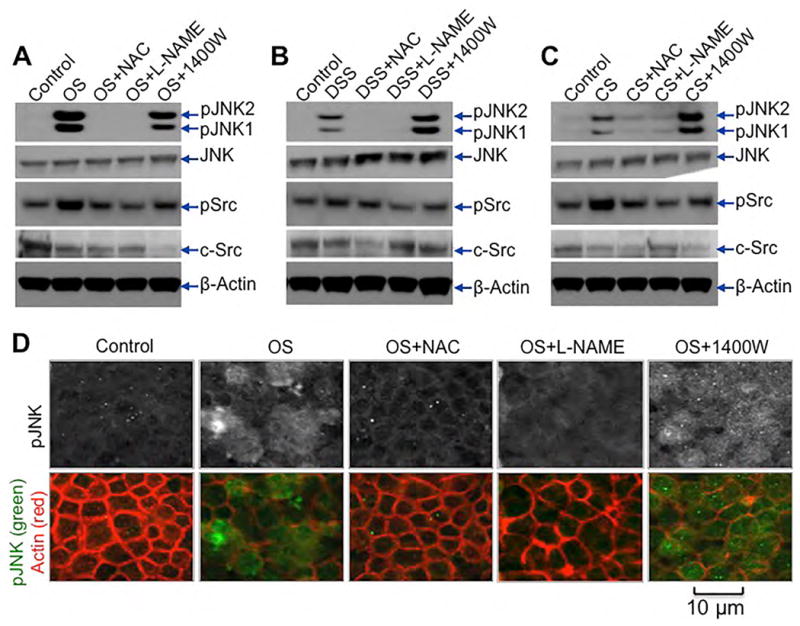
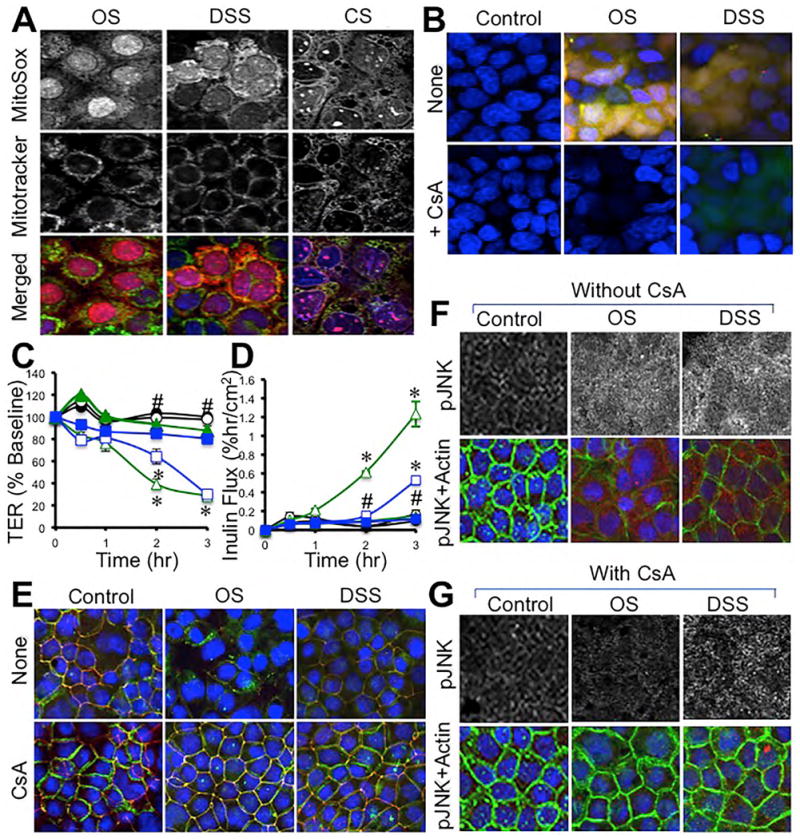
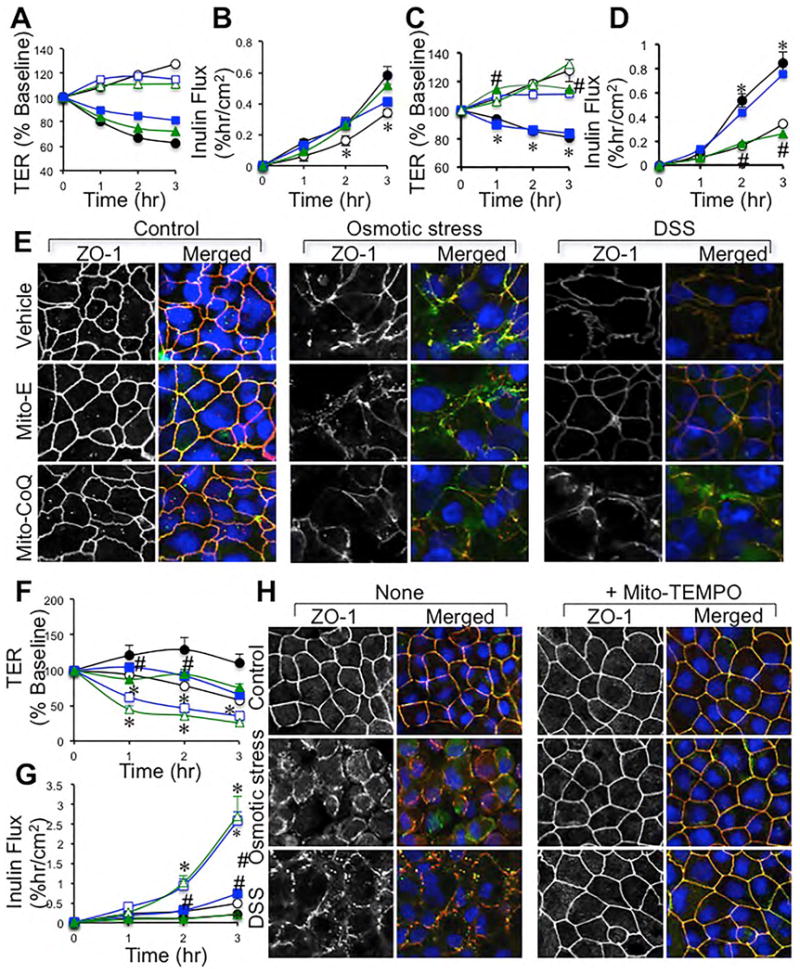
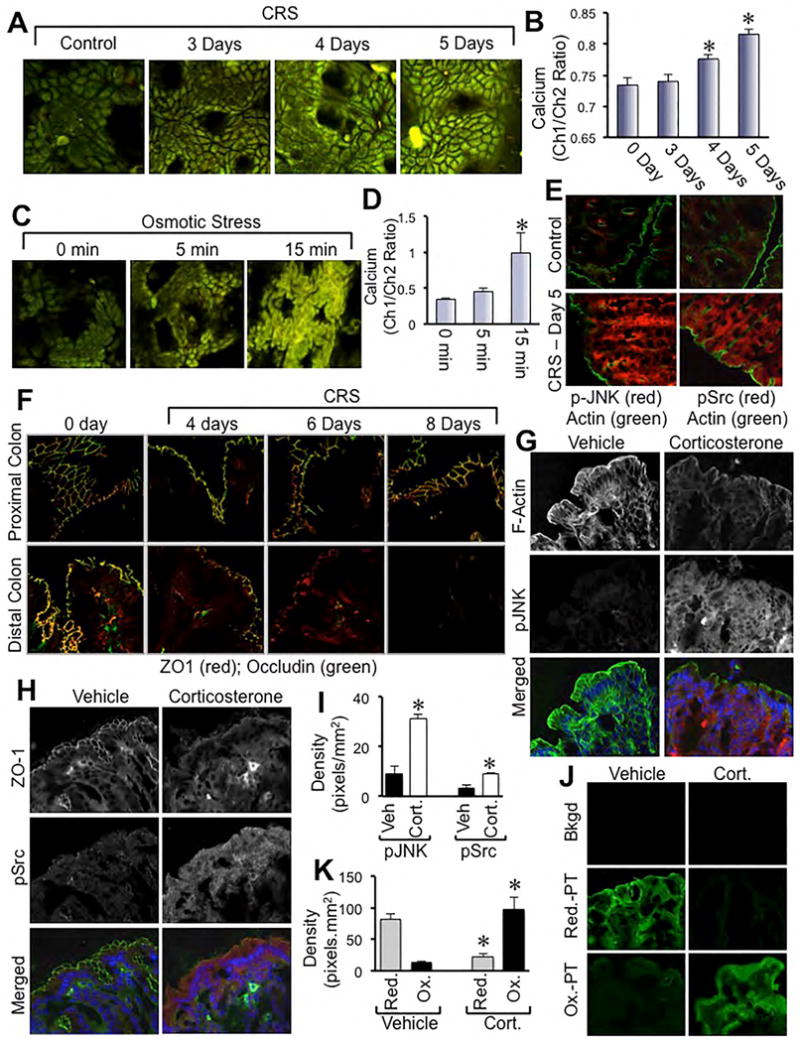
The role of reactive oxygen species (ROS) in osmotic stress, dextran sulfate sodium (DSS) and cyclic stretch-induced tight junction (TJ) disruption was investigated in Caco-2 cell monolayers in vitro and restraint stress-induced barrier dysfunction in mouse colon in vivo Live cell imaging showed that osmotic stress, cyclic stretch and DSS triggered rapid production of ROS in Caco-2 cell monolayers, which was blocked by depletion of intracellular Ca2+ by 1,2-bis-(o-aminophenoxy)ethane-N,N,N',N'-tetraacetic acid. Knockdown of CaV1.3 or TRPV6 channels blocked osmotic stress and DSS-induced ROS production and attenuated TJ disruption and barrier dysfunction. N-Acetyl l-cysteine (NAC) and l-NG-Nitroarginine methyl ester (l-NAME) blocked stress-induced TJ disruption and barrier dysfunction. NAC and l-NAME also blocked stress-induced activation of c-Jun N-terminal kinase (JNK) and c-Src. ROS was colocalized with the mitochondrial marker in stressed cells. Cyclosporin A blocked osmotic stress and DSS-induced ROS production, barrier dysfunction, TJ disruption and JNK activation. Mitochondria-targeted Mito-TEMPO blocked osmotic stress and DSS-induced barrier dysfunction and TJ disruption. Chronic restraint stress in mice resulted in the elevation of intracellular Ca2+, activation of JNK and c-Src, and disruption of TJ in the colonic epithelium. Furthermore, corticosterone administration induced JNK and c-Src activation, TJ disruption and protein thiol oxidation in colonic mucosa. The present study demonstrates that oxidative stress is a common signal in the mechanism of TJ disruption in the intestinal epithelium by different types of cellular stress in vitro and bio behavioral stress in vivo.

Keywords: ROS; adherens junction; barrier function; epithelium; intestine; tight junction.


Figures

Fig. 1
Fig. 1. Different types of stress induce rapid production of ROS in Caco-2 cell monolayers by a [Ca2+]i-dependent mechanism
A-C: Cell monolayers were preloaded with MitoSOX™, DCF-DA and Hoechst 33342 forty min prior to exposure to osmotic stress (A), DSS (B) or cyclic stretch (C) for varying times and fluorescence images collected for MitoSOX™ (red), DCF (green) and nucleus (blue) by confocal microscopy. D: Cell monolayers were preloaded with MitoSOX™, DCF-DA, and Hoechst 33342 with or without BAPTA forty min prior to exposure to osmotic stress, DSS or cyclic stretch. Fluorescence images for MitoSOX™ (red), DCF (green) and nucleus (blue) were captured simultaneously. All experiments were repeated at least two times.
Fig. 2
Fig. 2
A: Caco2 cells were transfected with CaV1.3 or TRPV6-specific shRNA constructs or vector and protein extracts from transfected cells were immunoblotted using specific antibodies. B: MitoSOX™ (red) and DCF (green)-sensitive ROS production was detected by live cell fluorescence imaging in Caco-2 cell monolayers transfected with the vector or CaV1.3 or TRPV6-specific shRNA constructs at 30 min exposure to osmotic stress (OS) or DSS. Experiments were repeated in at least two monolayers. C-F: Vector (■), CaV1.3 shRNA (▲) or TRPV6 (◆) shRNA-transfected cell monolayers were incubated with (closed symbols) or without (○) OS (C & D) or DSS (E & F). TER (C & E) and inulin permeability (D & F) were measured at varying times. Values are mean ± SEM (n = 4). Asterisks indicate OS or DSS values that are significantly different (p<0.05) from corresponding values for CaV1.3 or TRPV6 cell monolayers. G: Vector, CaV1.3 shRNA or TRPV6 shRNA-transfected cell monolayers were incubated with or without OS or DSS. At 3-hour treatment, cell monolayers were fixed and stained for occludin (green), ZO-1 (red) and nucleus (blue). Analyses were repeated in at least two more monolayers.
Fig. 3
Fig. 3. Antioxidants attenuate stress-induced barrier dysfunction in Caco-2 cell monolayers
Cell monolayers in transwells were pretreated with (gray symbols) or without (closed circles), NAC (triangles), L-NAME (diamonds) or 1400W (squares) prior to exposure to osmotic stress (A & B) or DSS (C & D). Control cell monolayers received no treatments (open circles). TER (A & C) and inulin flux (B & D) were measured at varying times. Values are mean ± SEM (n = 6). Asterisks indicate the values that are significantly (p<0.05) different from corresponding control values. Hash tags indicate the values that are significantly (p<0.05) different from corresponding osmotic stress or DSS values.
Fig. 4
Fig. 4. Antioxidants block stress-induced TJ disruption in Caco-2 cell monolayers
Cell monolayers in transwells were pretreated with or without, NAC, L-NAME or 1400W prior to exposure to osmotic stress (OS; A), DSS (B) or cyclic stretch (CS; C). After 3 hours, cell monolayers were fixed and stained for occludin (green) and ZO-1 (red). Gray scale images provided only for ZO-1 and images for occludin are similar to that for ZO-1. Analyses were repeated in at least two more monolayers.
Fig. 5
Fig. 5. Antioxidants block stress-induced AJ disruption in Caco-2 cell monolayers
Cell monolayers in transwells were pretreated with or without, NAC, L-NAME or 1400W prior to exposure to osmotic stress (OS; A), DSS (B) or cyclic stretch (CS; C). After 3 hours, cell monolayers were fixed and stained for E-cadherin (green) and β-catenin (red). Gray scale images are provided only for E-cadherin. Gray scale images provided only for E-cadherin and images for β-catenin are similar to that for E-cadherin. Analyses were repeated in at least two more monolayers.
Fig. 6
Fig. 6. Antioxidants block stress-induced activation of JNK and c-Src in Caco-2 cell monolayers
A-C: Cell monolayers in transwells were pretreated with or without, NAC, L-NAME or 1400W prior to exposure to osmotic stress (OS; A), DSS (B) or cyclic stretch (CS; C). At 30 min, extracts from cell monolayers were immunoblotted for pJNK, pSrc, JNK, c-Src and actin. These experiments were repeated twice with similar results. D: Cell monolayers in transwells were pretreated with or without, NAC, L-NAME or 1400W prior to exposure to osmotic stress (OS). After 30 min, cell monolayers were fixed and stained for F-actin (red) and pJNK (green). All experiments were repeated in at least two times.
Fig. 7
Fig. 7. Role of mitochondria in stress-induced barrier dysfunction, TJ disruption, ROS production and JNK activation
A: Caco-2 cell monolayers were loaded with MitoSOX™ and MitoTracker®. After 30 min, cells exposed to osmotic stress (OS), DSS or cyclic stretch (CS) for 30 min. Images for MitoSOX™ (red), MitoTracker® (green) and nucleus (blue) were captured by confocal microscopy. B: Caco-2 cell monolayers preloaded with MitoSOX™ and DCF-DA and preincubated with or without CsA were exposed to OS or DSS. At 30 min after onset of OS or DSS treatment, fluorescence was imaged for MitoSOX™ (red), DCF (green) and nucleus (blue). C-E: Cell monolayers on transwells were preincubated with (closed symbols) or without (open symbols) CsA 30 min prior to onset of osmotic stress (OS; triangles, green lines), DSS (squares, blue lines) or control treatment (circles, black lines). TER (C) and inulin flux (D) were measured at varying times. Values are mean ± SEM (n = 6). Asterisks indicate the values that are significantly (p<0.05) different from corresponding control values. Hash tags indicate the values that are significantly (p<0.05) different from corresponding OS or DSS values. At 3 hours, fixed cell monolayers were stained for occludin (green), ZO-1 (red) and nucleus (blue) (E). F & G: Cell monolayers preincubated with (G) or without CsA (F) for 30 min and exposed to OS or DSS for 30 min prior to fixation and staining for F-actin (green) and pJNK (red). All imaging analyses were repeated in at least two more monolayers.
Fig. 8
Fig. 8. Effects of mitochondria-targeted antioxidants on osmotic stress and DSS-induced barrier dysfunction and TJ disruption
A-E: Caco-2 cell monolayers were preincubated with (open symbols) or without (closed symbols) Mito-Vitamin E (▲, △, green lines) or Mito-CoQ (■, □, blue lines) for 30 min prior to treatment with osmotic stress (A & B) or DSS treatment (C & D). Control cell monolayers received no treatments (●, ○). TER (A & C) and inulin permeability (B & D) were measured at varying times. Values are mean ± SEM (n = 4-6). Asterisks indicate OS or DSS values that are significantly different (p<0.05) from corresponding values for control cell monolayers. Hash tags indicate the values for OS and DSS with antioxidant that are significantly different (p<0.05) from corresponding values for OS and DSS without antioxidant. At 3-hour treatment, cell monolayers were fixed and stained for occludin (green), ZO-1 (red) and nucleus (blue) (E). F-H: Caco-2 cell monolayers were preincubated with (closed symbols) or without (open symbols) Mito-TEMPO for 30 min prior to treatment with osmotic stress (triangles, green lines) or DSS treatment (squares, blue lines). Control cell monolayers received no treatments (circles, black lines). TER (F) and inulin permeability (G) were measured at varying times. Values are mean ± SEM (n = 4-6). Asterisks indicate that OS or DSS values that are significantly different (p<0.05) from corresponding values for control cell monolayers. Hash tags indicate the OS and DSS with antioxidant values that are significantly different (p<0.05) from corresponding values for OS and DSS without antioxidant. At 3-hour treatment, cell monolayers were fixed and stained for occludin (green), ZO-1 (red) and nucleus (blue) (H). All imaging analyses were repeated in at least two more monolayers.
Fig. 9
Fig. 9. Chronic restraint stress and corticosterone administration activate Ca2+/JNK/c-Src signaling, induce oxidative stress and disrupt TJ integrity in mouse colon
A-D: Adult mice were subjected to chronic restraint stress (CRS) for varying times (A). Colonic strips (immediately following last cycle of restraint stress) were mounted to Sylgard-coated plates, loaded with Indo-1 for 30 min and fluorescence measured at two channels as described in Methods (A) and the fluorescence ratio recorded (B). In another set of experiments, mucosal strips from untreated mice loaded with Indo-1 as above were exposed to osmotic stress for varying times (C & D). Fluorescence images were captured (C) and quantitated by ratiometric analysis as above (D). Values are mean ± SEM (n = 4). Asterisks indicate the values that are significantly (p<0.05) different from corresponding 0-Day or 0-min values. E & F: Cryosections of distal and/or proximal colons from mice subjected to CRS for 5 days (E) or varying times (F) were stained for F-actin and pJNK or pSrc (E), or occludin and ZO-1 (F). G-J: Adult mice were injected with corticosterone daily for 7 days. Cryosections of distal colon were stained for F-actin (green), pJNK (red) and nucleus (blue) (G) or ZO-1 (green), pSrc (red) and nucleus (blue) (H). Density of pJNK and pSrc fluorescence was measured in vehicle (Veh) and corticosterone (Cort.) treated mouse colon (I). Values are mean ± SEM (n = 4). Asterisk indicates the value that is significantly (p<0.05) different from corresponding Veh value. Cryosections of colons from vehicle or corticosterone (Cort.) were also stained for reduced (Red.-PT) and oxidized (Ox.-PT) protein thiols. Fluorescence images collected using a confocal microscope (J). Background (Bkgd) fluorescence was captured as described in Methods. Density of Red.-PT and Ox,-PT fluorescence was measured in vehicle (Veh) and corticosterone (Cort.) treated mouse colon (K). Values are mean ± SEM (n = 4). Asterisk indicates the value that is significantly (p<0.05) different from corresponding Veh value. All imaging analyses were repeated in at least two more monolayers.

Similar articles

Cited by

References

    1. Konturek PC, Brzozowski T, Konturek SJ. Stress and the gut: pathophysiology, clinical consequences, diagnostic approach and treatment options. J Physiol Pharmacol. 2011;62:591–599. - PubMed
    1. Jager S, Stange EF, Wehkamp J. Inflammatory bowel disease: an impaired barrier disease. Langenbecks Arch Surg. 2013;398:1–12. - PubMed
    1. Odenwald MA, Turner JR. Intestinal permeability defects: is it time to treat? Clin Gastroenterol Hepatol. 2013;11:1075–1083. - PMC - PubMed
    1. Pastorelli L, De Salvo C, Mercado JR, Vecchi M, Pizarro TT. Central role of the gut epithelial barrier in the pathogenesis of chronic intestinal inflammation: lessons learned from animal models and human genetics. Front Immunol. 2013;4:280. - PMC - PubMed
    1. Cameron HL, Perdue MH. Stress impairs murine intestinal barrier function: improvement by glucagon-like peptide-2. J Pharmacol Exp Ther. 2005;314:214–220. - PubMed

MeSH terms