

In Vivo Evidence of Reduced Integrity of the Gray-White Matter Boundary in Autism Spectrum Disorder
- PMID: 28057721
- PMCID: PMC6093436
- DOI: 10.1093/cercor/bhw404
In Vivo Evidence of Reduced Integrity of the Gray-White Matter Boundary in Autism Spectrum Disorder
Abstract
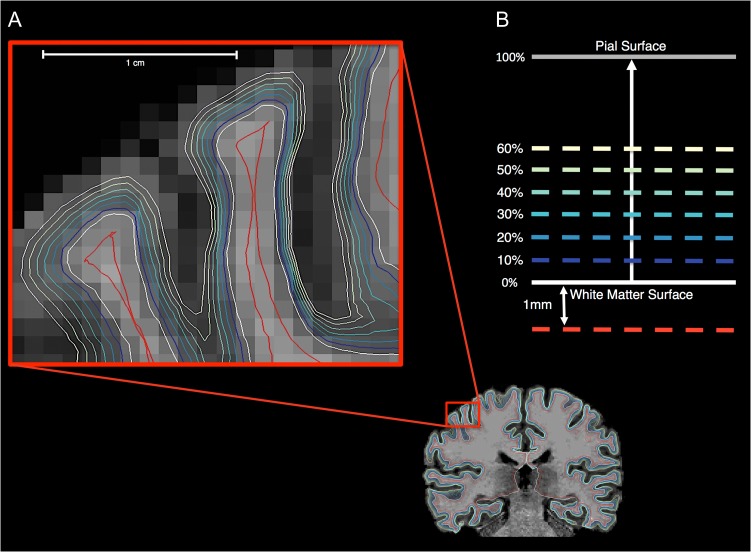
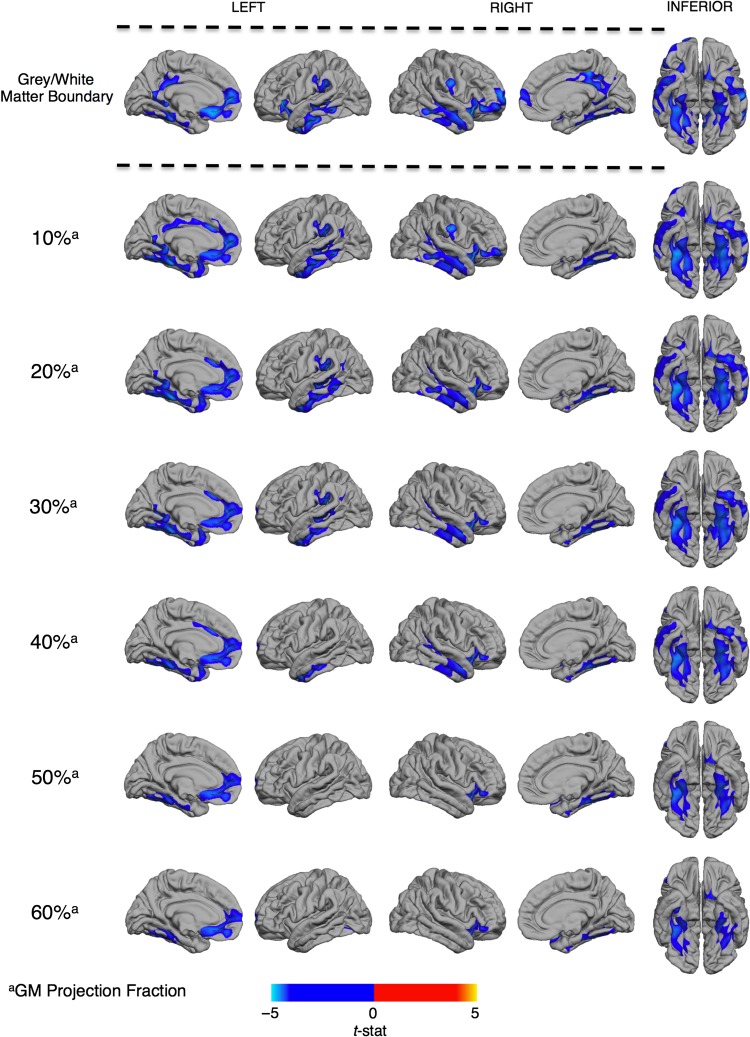
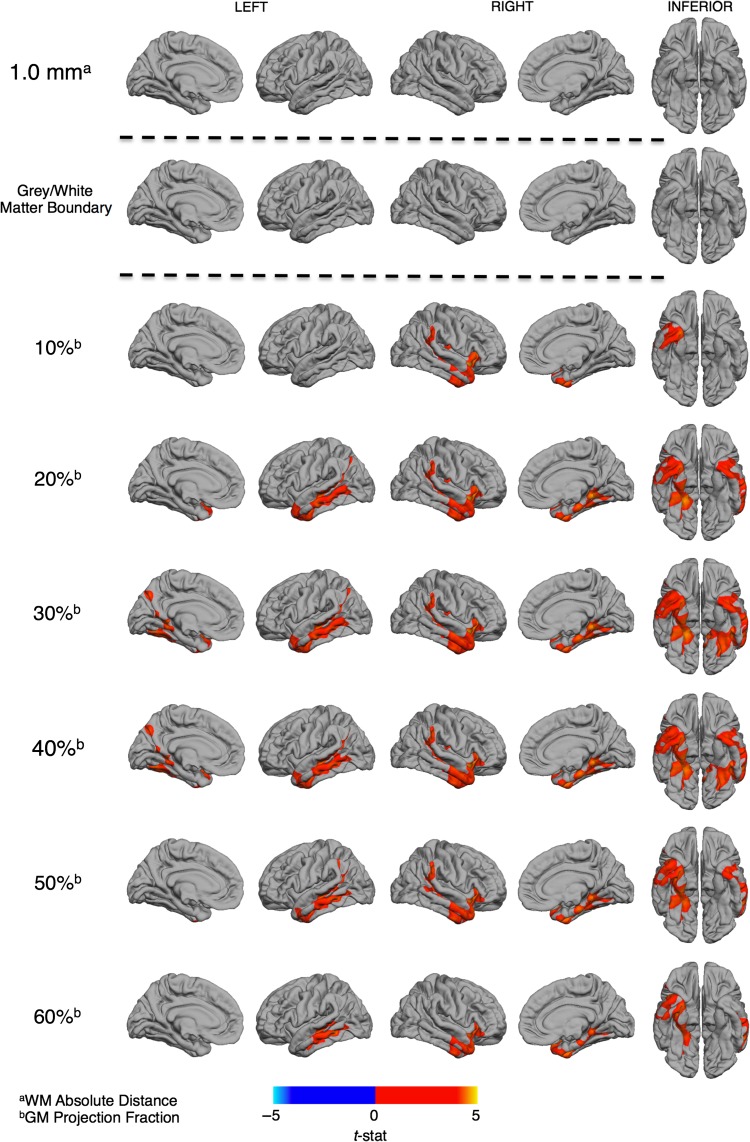
Atypical cortical organization and reduced integrity of the gray-white matter boundary have been reported by postmortem studies in individuals with autism spectrum disorder (ASD). However, there are no in vivo studies that examine these particular features of cortical organization in ASD. Hence, we used structural magnetic resonance imaging to examine differences in tissue contrast between gray and white matter in 98 adults with ASD and 98 typically developing controls, to test the hypothesis that individuals with ASD have significantly reduced tissue contrast. More specifically, we examined contrast as a percentage between gray and white matter tissue signal intensities (GWPC) sampled at the gray-white matter boundary, and across different cortical layers. We found that individuals with ASD had significantly reduced GWPC in several clusters throughout the cortex (cluster, P < 0.05). As expected, these reductions were greatest when tissue intensities were sampled close to gray-white matter interface, which indicates a less distinct gray-white matter boundary in ASD. Our in vivo findings of reduced GWPC in ASD are therefore consistent with prior postmortem findings of a less well-defined gray-white matter boundary in ASD. Taken together, these results indicate that GWPC might be utilized as an in vivo proxy measure of atypical cortical microstructural organization in future studies.
Keywords: ASD; FreeSurfer; MRI; imaging; lamination.
© The Author 2017. Published by Oxford University Press.
Figures
References
-
- Amaral DG, Schumann CM, Nordahl CW. 2008. Neuroanatomy of autism. Trends Neurosci. 31:137–145. - PubMed
-
- Andres M, Andre V, Nguyen S, Salamon N, Cepeda C, Levine MS, Leite JP, Neder L, Vinters HV, Mathern GW. 2005. Human cortical dysplasia and epilepsy: an ontogenetic hypothesis based on volumetric MRI and NeuN neuronal density and size measurements. Cereb cortex. 15:194–210. - PubMed
-
- Avino TA, Hutsler JJ. 2010. Abnormal cell patterning at the cortical gray–white matter boundary in autism spectrum disorders. Brain Res. 1360:138–146. - PubMed
-
- Balardin JB, Comfort WE, Daly E, Murphy C, Andrews D, Murphy DG, Ecker C, MRC AIMS Consortium, Sata J. 2015. Decreased centrality of cortical volume covariance networks in autism spectrum disorders. J Psychiatr Res. 69:142–149. - PubMed
Publication types
MeSH terms
Grants and funding
LinkOut - more resources
Full Text Sources
Other Literature Sources
Medical
Research Materials
