. 2018 Feb 1;28(2):602-611.
doi: 10.1093/cercor/bhw400.

How the Brain Converts Negative Evaluation into Performance Facilitation

Affiliations

How the Brain Converts Negative Evaluation into Performance Facilitation

Charlotte Prévost et al. Cereb Cortex. .

Abstract

Surpassing negative evaluation is a recurrent theme of success stories. Yet, there is little evidence supporting the counterintuitive idea that negative evaluation might not only motivate people, but also enhance performance. To address this question, we designed a task that required participants to decide whether taking up a risky challenge after receiving positive or negative evaluations from independent judges. Participants believed that these evaluations were based on their prior performance on a related task. Results showed that negative evaluation caused a facilitation in performance. Concurrent functional magnetic resonance imaging revealed that the motivating effect of negative evaluation was represented in the insula and striatum, while the performance boost was associated with functional positive connectivity between the insula and a set of brain regions involved in goal-directed behavior and the orienting of attention. These findings provide new insight into the neural representation of negative evaluation-induced facilitation.

Keywords: decision-making; neuroimaging; performance; psychological reactance.


Figures

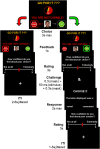
Figure 1.
Figure 1.
Test phase. On each trial, participants were given 3 s to decide whether taking up a challenge to earn 5 extra cents but risking receiving a mild electric shock at the end of the experiment as indicated by the red portion of the chart (P = 0.5, 0.6, or 0.7) if they failed the challenge, or not taking up the challenge and not earning extra money nor receiving any shock. They were given evaluation on a trial basis as to whether a judge thought they were capable (Encouragement condition), or not capable (Discouragement condition) to succeed at the challenge based on their performance in the Evaluation Phase, or not given any evaluation (Control condition). In this example, the judge thinks the participant is not capable of succeeding and recommends not taking up the challenge. After participants’ choice was highlighted for 1 s, they were given 3 s to indicate the degree of confidence about their decision within a 3 s time period. If they decided not to go for the challenge, the trial ended with a 2–6 s jittered intertrial interval (ITI) (left column). If they decided to take up the challenge, a mask was displayed for 300 ms before and after the stimulus, which was a letter displayed for 50 ms (right column). They were then given 2 s to decide whether the letter displayed was a vowel or a consonant, before being asked to indicate their level of confidence about their answer within a 3 s time window. The trial ended with a 1–5 s jittered ITI.
Figure 2.
Figure 2.
Evaluation Phase behavioral results. (a) Choice rate for taking up the challenge across shock probabilities. Participants were significantly less likely to take up the challenge as the probability of getting shocked upon failure increased (repeated-measures ANOVA, P < 0.001). (b) Response time when deciding whether to take up the challenge across probabilities. Participants were significantly slower at deciding whether to take up the challenge at P = 0.6 (paired t-tests, P < 0.05). (c) Confidence rating about their decision to take up the challenge or not across probabilities. Participants were less confident about their decision at P = 0.6 (paired t-tests, P < 0.01). (d) Success rate at the challenge across probabilities. Overall, participants were successful at the challenge 62 ± 14% of the time. Success rate was not significantly different across probabilities (paired t-tests, all P > 0.3). Error bars represent standard error of the mean (SEM). ***P < 0.001, ** P < 0.01, * P < 0.05, n.s. P > 0.05.
Figure 3.
Figure 3.
Test Phase behavioral results. (a) Choice rate to “Go for it!” across the Discouragement (Dis), Control, and Encouragement (Enc) conditions. Deciding whether to take up the challenge was significantly influenced by the evaluation condition (Repeated-measures ANOVA, P < 0.001). (b) Individual differences in the decision of taking up the challenge in the Discouragment (Dis) and Encouragement (Enc) conditions as compared to the Control condition. The horizontal line represents the choice rate to “Go for it!” in the Control condition for any given participant. Each cross represents a participant. As shown, while encouragement had a consistent motivating effect on taking up the challenge across participants, discouragement had either a deterrent or motivating effect on participants’ decision. (c) Success rate at detecting the stimulus across conditions. Participants were significantly more successful at the challenge in the Discouragement condition as compared to the Control condition and the Encouragement condition (paired t-tests, P < 0.05). Error bars represent SEM. (d) Reactant behavior versus Performance increase in the discouragement as compared to the control condition for all participants. While the tendency to exhibit reactant behavior varied greatly across individuals, performance increase following discouragement was enhanced in most individuals. Each dot represents a participant. ***P < 0.001 and * P < 0.05, n = 25.
Figure 4.
Figure 4.
fMRI signals. (a) BOLD signal correlating with the increased likelihood of taking up the challenge when being discouraged across participants in the insula (left panel) and striatum (right panel). (b) lOFC exhibits an increased correlation with insula activity during successful Discouragement trials as compared to successful Control trials. (c) BOLD signal in IPS showing an increased correlation with insula activity and positively correlating with performance increase in Discouragement trials as compared to Control trials across participants. (d,e) Scatter plots showing the β estimates in the insula (d) and striatum (e) correlating with the increased propensity of taking up the challenge when being discouraged for each participant. (f) Plot showing β estimates in lOFC for successful trials in the Discouragement (Dis), Control, and Encouragement (Enc) conditions. Note that these beta estimates were extracted from the GLM used for the PPI analysis and should not be interpreted in terms of connectivity. Error bars represent SEM. (g) Scatter plot showing the β estimates in IPS correlating with the increased success in the Discouragement condition for each participant. All activities are reported using a height threshold of P < 0.001, and an SVC significant at P < 0.05.

Similar articles

Cited by

References

    1. Antonucci AS, Gansler DA, Tan S, Bhadelia R, Patz S, Fulwiler C. 2006. Orbitofrontal correlates of aggression and impulsivity in psychiatric patients. Psychiatry Res. 147:213–220. - PubMed
    1. Bengtsson SL, Dolan RJ, Passingham RE. 2011. Priming for self-esteem influences the monitoring of one's own performance. Soc Cogn Affect Neurosci. 6:417–425. - PMC - PubMed
    1. Bengtsson SL, Lau HC, Passingham RE. 2009. Motivation to do well enhances responses to errors and self-monitoring. Cereb Cortex. 19:797–804. - PMC - PubMed
    1. Brehm JW. 1966. A theory of psychological reactance In: Burke WW, Lake DG, Paine JV, editors. Organization change: a comprehensive reader. Wiley, San Francisco: Jossey-Bass.
    1. Brockner J, Elkind M. 1985. Self-esteem and reactance: further evidence of attitudinal and motivational consequences. J Exp Soc Psychol. 21:346–361.

Publication types