. 2017 Mar;91(3):229-236.
doi: 10.1124/mol.116.107326. Epub 2017 Jan 5.

Olefin Isomers of a Triazole Bisphosphonate Synergistically Inhibit Geranylgeranyl Diphosphate Synthase

Affiliations

Olefin Isomers of a Triazole Bisphosphonate Synergistically Inhibit Geranylgeranyl Diphosphate Synthase

Cheryl Allen et al. Mol Pharmacol. 2017 Mar.

Abstract

The isoprenoid donor for protein geranylgeranylation reactions, geranylgeranyl diphosphate (GGDP), is the product of the enzyme GGDP synthase (GGDPS) that condenses farnesyl diphosphate (FDP) and isopentenyl pyrophosphate. GGDPS inhibition is of interest from a therapeutic perspective for multiple myeloma because we have shown that targeting Rab GTPase geranylgeranylation impairs monoclonal protein trafficking, leading to endoplasmic reticulum stress and apoptosis. We reported a series of triazole bisphosphonate GGDPS inhibitors, of which the most potent was a 3:1 mixture of homogeranyl (HG) and homoneryl (HN) isomers. Here we determined the activity of the individual olefin isomers. Enzymatic and cellular assays revealed that although HN is approximately threefold more potent than HG, HN is not more potent than the original mixture. Studies in which cells were treated with varying concentrations of each isomer alone and in different combinations revealed that the two isomers potentiate the induced-inhibition of protein geranylgeranylation when used in a 3:1 HG:HN combination. A synergistic interaction was observed between the two isomers in the GGDPS enzyme assay. These results suggested that the two isomers bind simultaneously to the enzyme but within different domains. Computational modeling studies revealed that HN is preferred at the FDP site, that HG is preferred at the GGDP site, and that both isomers may bind to the enzyme simultaneously. These studies are the first to report a set of olefin isomers that synergistically inhibit GGDPS, thus establishing a new paradigm for the future development of GGDPS inhibitors.


Figures

Fig. 1.
Fig. 1.
Inhibitors of FDPS and GGDPS. Chemical structures of FDPS and GGDPS inhibitors. IC50 values are presented for previously published GGDPS inhibitors.
Fig. 2.
Fig. 2.
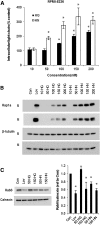
HN more potently disrupts protein geranylgeranylation than HG. RPMI-8226 and MM.1S cells were incubated for 48 hours in the presence or absence of varying concentrations of HG and HN (10–200 nM). (A) RPMI-8226 intracellular lambda light chain levels were measured via ELISA. Data are expressed as a percentage of control (mean ± standard deviation of 3 independent experiments). *Denotes statistical significance as determined by analysis of variance (ANOVA) testing with the Holm correction for multiple comparisons comparing treated cells to control cells. (B) Immunoblot analysis of whole cell lysate [RPMI-8826 (R), MM.1S (M)] for Rap1a (antibody detects only unmodified protein), and β-tubulin (loading control) was performed. Lovastatin (Lov, 10 μM) was included as a positive control. Blots are representative of at least three independent experiments. (C) RPMI-8226 cells were incubated for 48 hours in the presence or absence of lovastatin (Lov, 10 μM), HG (50 or 150 nM), or HN (50 or 150 nM). Triton X-114 lysis was performed with immunoblot analysis of Rab6 (representative Rab GTPase) and calnexin (loading control). Densitometric analysis of Rab6 (normalized to calnexin) for the treated cells normalized to untreated (control) cells is shown. Data are displayed as mean ± standard deviation (n = 3 independent experiments). *Denotes statistical significance as determined by ANOVA testing with the Holm correction for multiple comparisons comparing treated cells to control cells.
Fig. 3.
Fig. 3.
Effects of HG, HN, and the mixture 6 on intracellular GGDP levels. RPMI-8226 cells were treated for 48 hours with varying concentrations (50–200 nM) of HG, HN, or the mixture 6. GGDP was extracted and quantified as described in Materials and Methods. Data are expressed as a percentage of control (mean ± standard deviation of two independent experiments). *Denotes statistical significance as determined by ANOVA testing with the Holm correction for multiple comparisons comparing treated cells to control cells.
Fig. 4.
Fig. 4.
Lovastatin enhances the effects of HG and HN. RPMI-8226 cells were incubated for 48 hours in the presence or absence of lovastatin (Lov, 0.1 μM) and HG (50–100 nM) or HN (25–50 nM). (A) Intracellular lambda light chain levels were measured via ELISA. Data are expressed as a percentage of control (mean ± standard deviation of 3 independent experiments). *Denotes statistical significance as determined by ANOVA testing with the Holm correction for multiple comparisons comparing treatments with and without lovastatin. (B) Immunoblot analysis of whole cell lysate for Rap1a (antibody detects only unmodified protein) and β-tubulin (loading control) was performed. Blots are representative of at least three independent experiments.
Fig. 5.
Fig. 5.
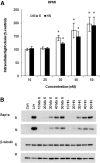
The mixture 6 and HN have similar cellular activity. RPMI-8226 and MM.1S cells were incubated for 48 hours in the presence or absence of varying concentrations (10–50 nM) of mixture 6 (Mix 6) and HN. (A) RPMI-8226 intracellular lambda light chain levels were measured via ELISA. Data are expressed as a percentage of control (mean ± standard deviation of 3 independent experiments). *Denotes statistical significance as determined by ANOVA testing with the Holm correction for multiple comparisons comparing treated cells to control cells. (B) Immunoblot analysis of whole cell lysate [RPMI-8826 (R), MM.1S (M)] for Rap1a (antibody detects only unmodified protein) and β-tubulin (loading control) was performed. Lovastatin (Lov, 10 μM) was included as a positive control. Blots are representative of three independent experiments.
Fig. 6.
Fig. 6.
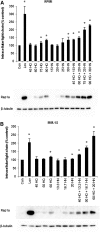
The combination of HG and HN in a 3:1 ratio enhances disruption of protein geranylgeranylation. RPMI-8226 and MM.1S cells were incubated for 48 hours in the presence or absence of varying concentrations (nM) of HG, HN, or the combination of the two isomers. Top, intracellular lambda light chain levels were measured via ELISA. Data are expressed as a percentage of control (mean ± standard deviation of 3 independent experiments). *Denotes statistical significance as determined by ANOVA testing with the Holm correction for multiple comparisons comparing treated cells to control cells. Bottom, immunoblot analysis of whole cell lysate [RPMI-8826 (R), MM.1S (M)] for Rap1a and β-tubulin (loading control) was performed. Lovastatin (Lov, 10 μM) was included as a positive control. Blots are representative of three independent experiments.
Fig. 7.
Fig. 7.
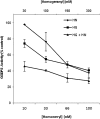
HG and HN inhibit GGDPS in a synergistic manner. Recombinant GGDPS was incubated with substrates ([14C]-IPP and FDP) in the presence or absence of inhibitors [HG, HN, or the two isomers in combination (3:1)] and GGDPS activity was determined via quantification of [14C]-GGDP. Data are expressed as mean ± standard deviation (n = 2) and are representative of three independent experiments.
Fig. 8.
Fig. 8.
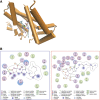
Modeling studies reveal preferential binding of HN to the FDP site and HG to the GGDP site and their ability to simultaneously bind GGDPS. (A) HN and HG docked to FDP and GGDP sites of GGDPS. The protein is represented in cartoon format with cylinders representing helices and colored orange. HN and HG are represented as licorice sticks and colored atom type (carbon = cyan, nitrogen = blue, oxygen = red, phosphorus = yellow, and sodium = purple). The position of the Mg2+ ion is shown as a green oval. (B) Two-dimensional representations of HN (left) and HG (right) docked to FDP and GGDP binding pockets generated using ligX module of MOE program. The schematic legend below describes the nature of the interactions.

References

    1. Aickin M, Gensler H. (1996) Adjusting for multiple testing when reporting research results: the Bonferroni vs Holm methods. Am J Public Health 86:726–728. - PMC - PubMed
    1. Barney RJ, Wasko BM, Dudakovic A, Hohl RJ, Wiemer DF. (2010) Synthesis and biological evaluation of a series of aromatic bisphosphonates. Bioorg Med Chem 18:7212–7220. - PubMed
    1. Bergstrom JD, Bostedor RG, Masarachia PJ, Reszka AA, Rodan G. (2000) Alendronate is a specific, nanomolar inhibitor of farnesyl diphosphate synthase. Arch Biochem Biophys 373:231–241. - PubMed
    1. Chou TC, Talalay P. (1984) Quantitative analysis of dose-effect relationships: the combined effects of multiple drugs or enzyme inhibitors. Adv Enzyme Regul 22:27–55. - PubMed
    1. Coxon FP, Helfrich MH, Van’t Hof R, Sebti S, Ralston SH, Hamilton A, Rogers MJ. (2000) Protein geranylgeranylation is required for osteoclast formation, function, and survival: inhibition by bisphosphonates and GGTI-298. J Bone Miner Res 15:1467–1476. - PubMed

Publication types