. 2016 Dec 29;3(6):ENEURO.0295-16.2016.
doi: 10.1523/ENEURO.0295-16.2016. eCollection 2016 Nov-Dec.

Remodeling of the Inner Hair Cell Microtubule Meshwork in a Mouse Model of Auditory Neuropathy AUNA1

Affiliations

Remodeling of the Inner Hair Cell Microtubule Meshwork in a Mouse Model of Auditory Neuropathy AUNA1

Clément Surel et al. eNeuro. .

Abstract

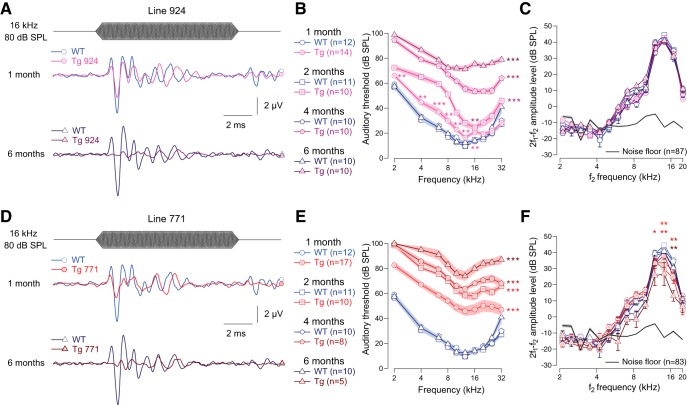
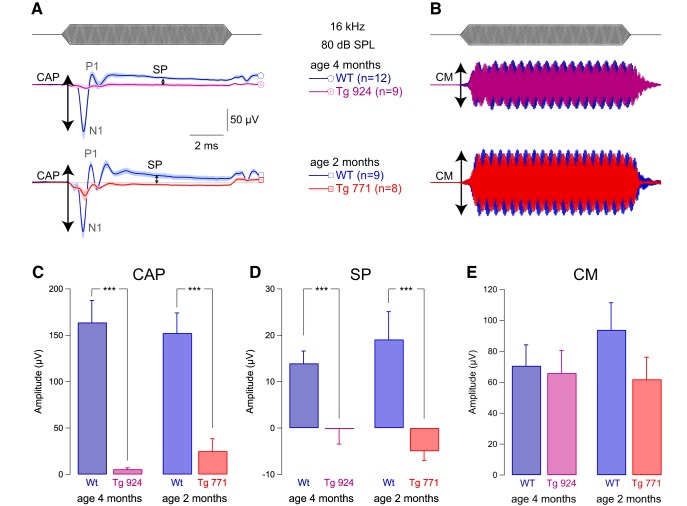
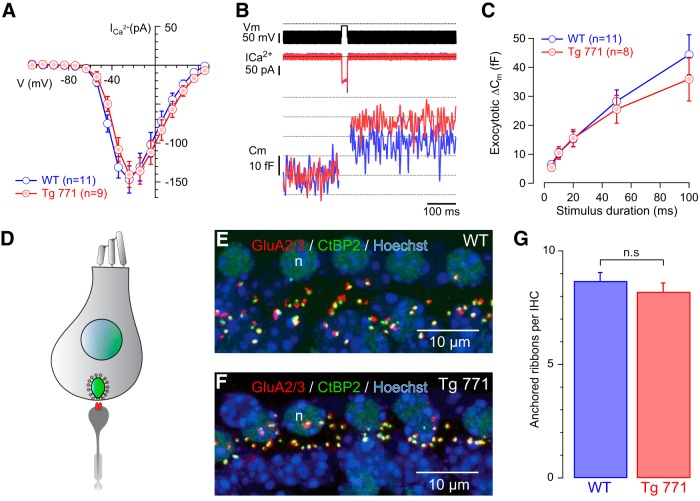
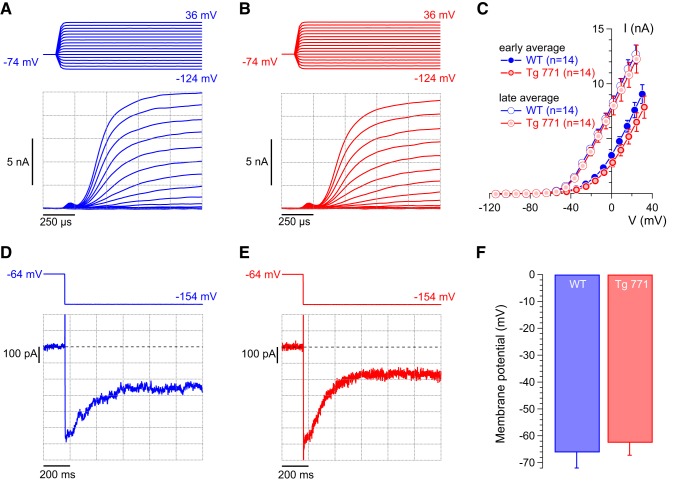
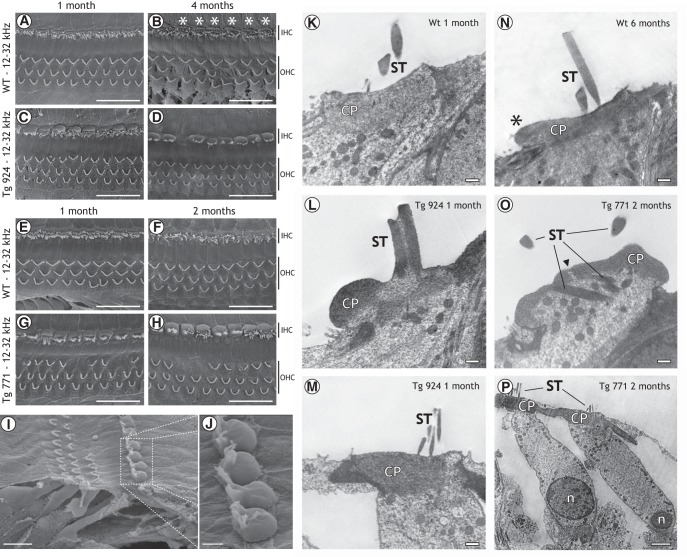
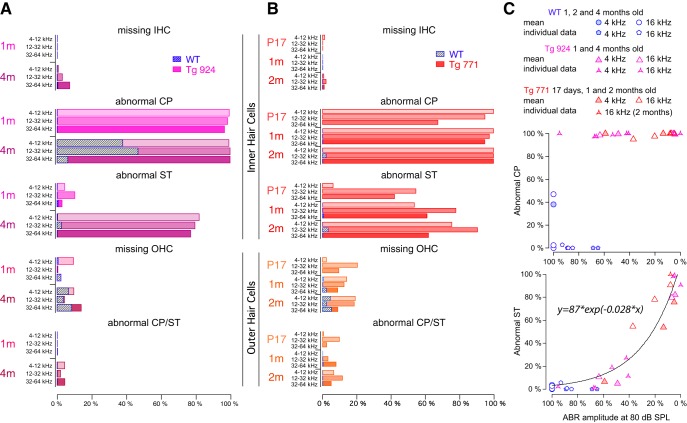
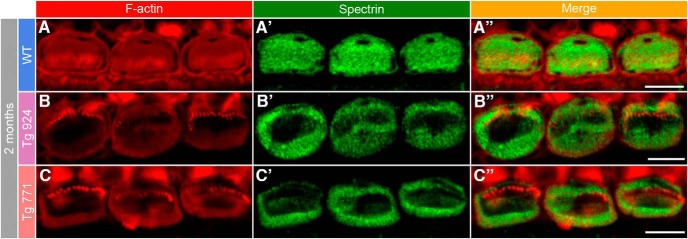
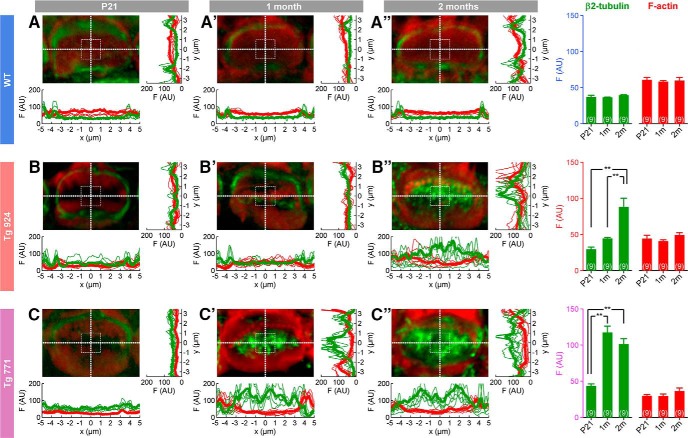
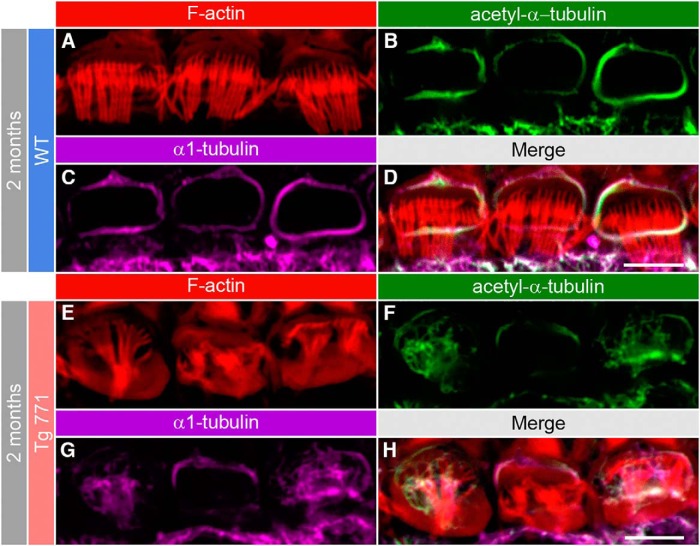
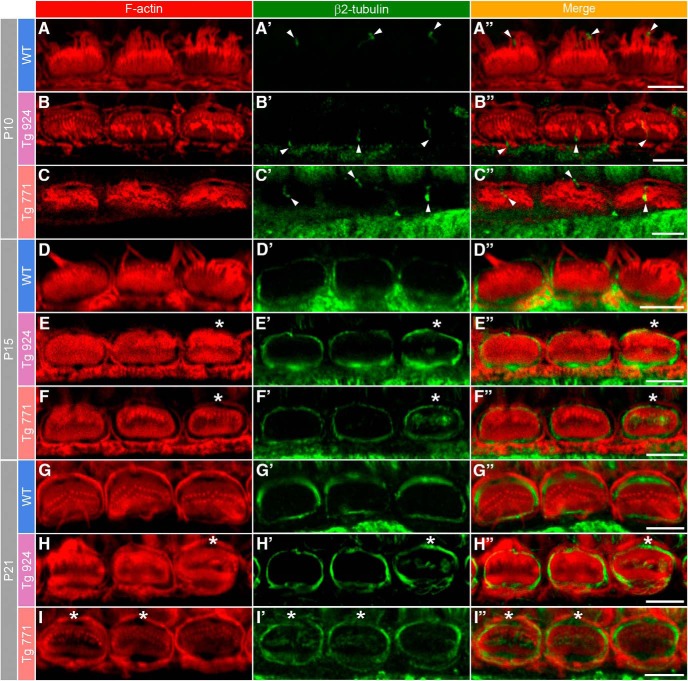
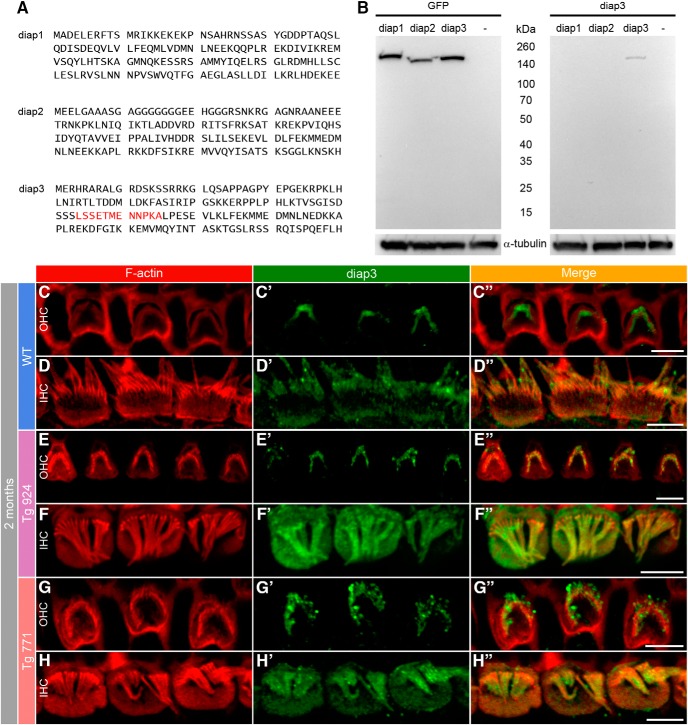
Auditory neuropathy 1 (AUNA1) is a form of human deafness resulting from a point mutation in the 5' untranslated region of the Diaphanous homolog 3 (DIAPH3) gene. Notably, the DIAPH3 mutation leads to the overexpression of the DIAPH3 protein, a formin family member involved in cytoskeleton dynamics. Through study of diap3-overexpressing transgenic (Tg) mice, we examine in further detail the anatomical, functional, and molecular mechanisms underlying AUNA1. We identify diap3 as a component of the hair cells apical pole in wild-type mice. In the diap3-overexpressing Tg mice, which show a progressive threshold shift associated with a defect in inner hair cells (IHCs), the neurotransmitter release and potassium conductances are not affected. Strikingly, the overexpression of diap3 results in a selective and early-onset alteration of the IHC cuticular plate. Molecular dissection of the apical components revealed that the microtubule meshwork first undergoes aberrant targeting into the cuticular plate of Tg IHCs, followed by collapse of the stereociliary bundle, with eventual loss of the IHC capacity to transmit incoming auditory stimuli.

Keywords: cochlea; cuticular plate; deafness; diap3; diaphanous.


Conflict of interest statement

Authors report no conflict of interest.

Figures

Figure 1.
Figure 1.
Transgenic mouse lines 924 (Tg 924) and 771 (Tg 771) mimic human AUNA1 deafness. A, D, Representative ABR recordings evoked by 16-kHz tone burst at 80 dB SPL from 1- and 6-month-old WT, Tg 924 (A), and Tg 771 (D) mice. B, E, Mean ABR audiograms from 1- to 6-month-old WT, Tg 924 (B), and Tg 771 (E) mice. C, F, DPOAEs from 1- to 6-month-old WT, Tg 924 (C), and Tg 771 (F) mice. The mean 2f1-f2 amplitude level is shown as a function of f2 frequency. The black line indicates the background noise level. n indicates the number of cochleae recorded. Level of significance: *p < 0.05; **p < 0.01; ***p < 0.001 (Wilcoxon test). For B and E, asterisks located next to the audiograms indicate a similar p-value for all the frequencies, except when otherwise noted.
Figure 2.
Figure 2.
IHC receptor potential is altered in diap3-overexpressing mice. A, Mean compound action potential (CAP; N1-P1 amplitude) and summating potential (SP), reflecting the auditory afferent fiber activation and IHC receptor potential, respectively. B, Cochlear microphonic (CM), reflecting the OHC activation. CAP, SP, and CM were evoked by 16-kHz tone burst at 80 dB SPL in 4-month-old WT and Tg 924 mice and 2-month-old WT and Tg 771 mice. C–E, Mean CAP amplitude (C), SP amplitude (D), and CM amplitude (E) from 4-month-old WT and Tg 924 mice and 2-month-old WT and Tg 771 mice. n indicates the number of cochleae recorded. Level of significance: ***p < 0.001 (Wilcoxon test).
Figure 3.
Figure 3.
Ca2+-triggered exocytosis is not impaired in diap3-overexpressing mice. A, Ca2+ current steady-state I/V relationships of WT (blue) and Tg 771 (red) mouse IHCs P13–P16. Steady-state amplitude was measured as the average over the last 5 ms of the 10-ms test pulse. B, Ca2+ current (ICa2+) and Cm traces, low-pass filtered at 100 Hz (from top to bottom) of representative WT (blue) and Tg (red) IHCs elicited by 20-ms depolarization to the peak Ca2+ current potential. C, Kinetics of exocytosis (Cm) of WT (blue) and Tg (red) IHCs. D, Scheme illustrating the synapse between IHC and afferent neuron. The IHC nucleus is shown in blue, the synaptic ribbon in green, and the postsynaptic glutamate receptor in red. E–G, Comparable number of IHC ribbon synapses between WT and Tg 771 mice. Presynaptic ribbons and postsynaptic glutamate receptors are labeled using antibodies against CtBP2 and GluA2/3, respectively (E, F). G, Note the comparable numbers of ribbon-containing afferent synapses per IHC from 1-month-old WT mice (8.67 ± 0.38 synapses/IHC, n = 79 IHCs examined) and Tg 771 mice (8.19 ± 0.39, n = 92 IHCs examined). No significant difference was found (p > 0.05), n.s: not significant.
Figure 4.
Figure 4.
Normal potassium currents in diap3-overexpressing mice. A, B, Representative outward currents recorded from 1-month-old WT (blue) and Tg 771 (red) IHCs. Currents were evoked by step depolarizations from a holding potential of –74 mV to the indicated potentials (voltage increment of 10 mV). C, Average I-V relationships for WT (in blue) and Tg 771 (in red) IHCs derived from averaging currents 375 µs after the start of the depolarizing pulses over 250 µs (early average) and over the last 50 ms of depolarization steps (late average). Early and late averages indicate, respectively, fast- and slow- activating potassium current, corresponding to BK and delayed-rectifier channels. n indicates the number of IHCs recorded. D, E, Representative current traces obtained from 1-month-old WT (blue, D) and Tg 771 (red, E) IHCs. Currents were elicited by a voltage step from a holding potential of –64 mV to a hyperpolarized potential of –154 mV. Zero current level is indicated by a dotted line. Note that the current was already activated at the resting potential of approximately –60 mV and became deactivated upon hyperpolarization, which is indicative of KCNQ4 currents. F, Mean resting membrane potential of WT (blue) and Tg 771 (red) IHCs (no current injection). The resting membrane potentials were not significantly different between the genotypes.
Figure 5.
Figure 5.
Morphological defects at the cuticular plate and stereociliar bundles in inner hair cells of diap3-overexpressing mice. A–J, SEM of the organ of Corti in 1-month-old (A, E), 4-month-old (B), and 2-month-old (F) WT mice, 1-month-old (C) and 4-month-old (D, I, J) Tg 924 mice, and 1-month-old (G) and 2-month-old (H) Tg 771 mice. Note the cuticular plate lump (white asterisk) in WT IHCs starting from 4 months old (B). In the Tg lines (C, D, G–J), a severe swelling of the IHC cuticular plate is observed for all ages. The alteration of the cuticular plate can be associated with disarrayed or fused stereociliar bundle. In addition, some OHCs are missing. K–P, TEM from hair cells in 1-month-old (K) and 6-month-old (N) WT mice, 1-month-old Tg 924 mice (L, M), and 2-month-old Tg 771 mice (O, P). K, In 1-month-old WT mice, the cuticular plate (CP) forms an electron-dense matrix, which is homogeneously distributed at the IHC apical pole, except at the fonticulus. Note the presence of numerous mitochondria below the CP and the well-organized stereocilia (ST) above. N, In 6-month-old WT mice, the CP still has a homogeneous distribution. Note that the CP area expands over the neighboring supporting cell (black asterisk), although TEM did not show swelling comparable to that seen in the Tg mice. L, In 1-month-old Tg 924 mice, the CP dramatically accumulated at the border of the IHC and the ST are fused. M, In 1-month-old Tg 924 mice, the apical pole of OHCs looks normal, with its CP anchoring the ST bundle. O, In 2-month-old Tg 771 mice, the ST are embedded in the IHC cytoplasm. The CP is not confined to its regular position, and the apical pole of the IHC protrudes toward the scala media. Note the discontinuous CP (arrow). P, In 2-month-old Tg 771 mice, OHCs show a normal appearance, with the CP anchoring the ST bundle. Scale bars: A–H: 20 µm, I: 10 µm, J: 2.5 µm, K–O: 500 nm, P: 2 µm.
Figure 6.
Figure 6.
Quantification of the anatomical alteration in hair cells of diap3-overexpressing mice. A, B, Abnormal CP indicates the increase of the cuticular plate area. Abnormal ST indicates disarrayed or fused stereocilia. Note that 4-month-old WT mice exhibit a large cuticular plate that could not be easily distinguished from diap3-overexpressing mice. For OHCs, abnormal CP and ST were pooled because of the minimal defect observed in these cells. C, Top, fraction of IHCs with an abnormal CP plotted against the reduction in the ABR amplitude probed at 80 dB SPL. ABR with various amplitude reductions (0–90%) can be measured with 100% IHCs harboring a swollen CP. C, Bottom, fraction of IHCs harboring an abnormal ST plotted against the reduction in the ABR amplitude probed at 80 dB SPL. The relationship between the reduction in ABR amplitude and the alteration in the stereociliar bundle can be fitted by the following exponential: y = a × exp(b × x), where y is the fraction of IHCs with abnormal stereocilia, x is the reduction in the ABR amplitude, and a and b are constants. For C, the mean values correspond to the degree of anatomical damage in the 4- and 16-kHz coding frequency regions from 1-, 2-, and 4-month-old mice and plotted against the ABR amplitude average at the corresponding coding frequencies (4 and 16 kHz) from different groups of 1-, 2-, and 4-month-old mice. Individual data values correspond to the anatomofunctional correlation that has been obtained in the same mice.
Figure 7.
Figure 7.
Disorganization of the cuticular plate components. A–A″, In 2-month-old WT IHCs, F-actin (red, A) and spectrin (green, A′) are homogeneously distributed in the whole cuticular plate, except for the kinocilium imprint. A″, Merge of both labels. B–C″, In 2-month-old Tg 924 (B–B″) and Tg 771 (C–C″) mice, actin filaments and spectrin are concentrated toward the periphery of the IHC apical part, leaving an empty space at the cuticular plate center. Scale bars: 5 µm.
Figure 8.
Figure 8.
Microtubule network remodeling in IHCs of diap3-overexpressing mice. A–C″, Fluorescence intensity distribution of microtubules (green) and F-actin (red) at the cuticular plate section through x and y sections in WT (A–A″), Tg 771 (B–B″) and Tg 924 (C–C″) lines at P21 (A, B, C), 1 month (A′, B′, C′), and 2 months (A″, B″, C″). Actin filaments are labeled using phalloidin-rhodamine (red), and microtubules are stained using an antibody against the β2-tubulin subunit (green). Pictures show a high magnification of the cuticular plate section over a single IHC. Thick and thin lines represent the average and individual fluorescence intensities (n = 9 IHCs in each condition), respectively. Right, histograms show the fluorescence average from an area of 4 µm2 located at the image center for the different genotypes and age. AU, arbitrary unit. **p < 0.01 (Student’s t-test).
Figure 9.
Figure 9.
Acetylated microtubules populate the cuticular plate center in the diap3-overexpressing mice. A–H, F-actin and microtubule distribution at the IHC apical side from 2-month-old WT (A–D) and Tg 771 (E–H) mice. Actin filaments are labeled by phalloidin-rhodamine (red, A, E), and microtubules are stained using antibody against acetyl-α1-tubulin (green, B, F) or against the α1-tubulin subunit (magenta, C, G). Scale bars: 5 µm.
Figure 10.
Figure 10.
Early onset of the microtubule remodeling. F-actin and microtubule distribution at the IHC apical side from WT (A, D, G), Tg 924 (B, E, H), and Tg 771 (C, F, I) mice at P10, P15, and P21. Actin filaments are labeled by phalloidin-rhodamine (red), and microtubules are stained using antibody against the β2 tubulin subunit (green). A–C″, At P10, the β2-tubulin staining is reminiscent of the kinocilium position (arrowheads). In 2- and 3-week-old WT mice, microtubules are distributed around the cuticular plate (green, D–D″, G–G″). In the P15 Tg 924 (E–E″ and H–H″), and P21 Tg 771 (F–F″ and I–I″), microtubules can be readily distinguished in the center of the cuticular plate below the stereociliar bundle (asterisk). Scale bars: 5 µm.
Figure 11.
Figure 11.
Accumulation of diap3 in the cuticular plate of IHCs of diap3-overexpressing mice. A, Amino acid (1–120) sequence of mouse diap1, diap2, and diap3. The LSSETMENNPKA motif in the diap3 protein sequence (red) has been used to generate the diap3 antibody. B, Western blot analysis of diap3 antibody specificity. HEK293 cells were transfected in parallel with plasmids encoding the GFP-diap1, GFP-diap2, or GFP-diap3 fusion protein. Protein extracts from HEK293 cells were probed with GFP (upper right) and diap3 (upper left) antibodies. –, nontransfected HEK293 cells. GFP staining indicates efficient expression for each diap-GFP fusion protein in HEK293 cells (at ∼160 kDa). Note that the diap3 antibody recognizes diap3-GFP protein but not diap1-GFP or diap2-GFP proteins. On lower panels, α-tubulin staining is used as protein loading control. C–D″, F-actin and diap3 localization at the apical side of OHCs (C–C″) and IHCs (D–D″) in 2-month-old WT mice. Actin filaments are labeled by phalloidin-rhodamine (red, C–D), and diap3 is stained using an anti-diap3 antibody (green, C′–D′). Diap3 is preferentially localized inside the stereocilia of both hair cells (C′–D′) and within the cuticular plate of IHCs (D′). C″–D″, Merge of both immunolabels. E–H″, Localization of F-actin and diap3 in 2-month-old Tg 924 (E–F″) and Tg 771 (G–H″) mice. Actin filaments are concentrated toward the periphery of the IHC apical part, leaving an actin-free zone in the IHC cuticular plate center (F, H). In Tg 771 (E′–F′) and Tg 924 (G′–H′) mice, diap3 accumulates in the cuticular plate and stereocilia of IHCs (F′–H′), and only shows a stereociliary bundle localization in OHCs (E′–G′). Scale bars: 5 µm.

References

    1. Bartolini F, Gundersen GG (2010) Formins and microtubules. Biochim Biophys Acta 1803:164–173. 10.1016/j.bbamcr.2009.07.006 - DOI - PMC - PubMed
    1. Bartolini F, Moseley JB, Schmoranzer J, Cassimeris L, Goode BL, Gundersen GG (2008) The formin mDia2 stabilizes microtubules independently of its actin nucleation activity. J Cell Biol 181:523–536. 10.1083/jcb.200709029 - DOI - PMC - PubMed
    1. Beurg M, Fettiplace R, Nam J-H, Ricci AJ (2009) Localization of inner hair cell mechanotransducer channels using high-speed calcium imaging. Nat Neurosci 12:553–558. 10.1038/nn.2295 - DOI - PMC - PubMed
    1. Bobbin RP, Fallon M, Kujawa SG (1991) Magnitude of the negative summating potential varies with perilymph calcium levels. Hear Res 56:101–110. - PubMed
    1. Bobbin RP, Jastreboff PJ, Fallon M, Littman T (1990) Nimodipine, an L-channel Ca2+ antagonist, reverses the negative summating potential recorded from the guinea pig cochlea. Hear Res 46:277–287. - PubMed

Publication types

MeSH terms

Supplementary concepts

LinkOut - more resources