. 2017 Apr;16(2):329-338.
doi: 10.1111/acel.12557. Epub 2017 Jan 6.

Biomarker signatures of aging

Affiliations

Biomarker signatures of aging

Paola Sebastiani et al. Aging Cell. 2017 Apr.

Abstract

Because people age differently, age is not a sufficient marker of susceptibility to disabilities, morbidities, and mortality. We measured nineteen blood biomarkers that include constituents of standard hematological measures, lipid biomarkers, and markers of inflammation and frailty in 4704 participants of the Long Life Family Study (LLFS), age range 30-110 years, and used an agglomerative algorithm to group LLFS participants into clusters thus yielding 26 different biomarker signatures. To test whether these signatures were associated with differences in biological aging, we correlated them with longitudinal changes in physiological functions and incident risk of cancer, cardiovascular disease, type 2 diabetes, and mortality using longitudinal data collected in the LLFS. Signature 2 was associated with significantly lower mortality, morbidity, and better physical function relative to the most common biomarker signature in LLFS, while nine other signatures were associated with less successful aging, characterized by higher risks for frailty, morbidity, and mortality. The predictive values of seven signatures were replicated in an independent data set from the Framingham Heart Study with comparable significant effects, and an additional three signatures showed consistent effects. This analysis shows that various biomarker signatures exist, and their significant associations with physical function, morbidity, and mortality suggest that these patterns represent differences in biological aging. The signatures show that dysregulation of a single biomarker can change with patterns of other biomarkers, and age-related changes of individual biomarkers alone do not necessarily indicate disease or functional decline.

Keywords: biological aging; biomarkers; healthy aging; morbidity and mortality.


Figures

Figure 1
Figure 1
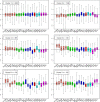
Six signatures of 19 biomarkers. Side‐by‐side boxplots display the distributions of the 19 standardized biomarkers in LLFS participants allocated to each cluster. Biomarkers are grouped and colored by function (salmon: inflammation; green: anemia; blue: diabetes; red: lipid; cyan: endocrine; magenta: renal). In each plot, the horizontal line at 0 represents the expected values of the standardized biomarkers, and hence, the value of biomarkers expected for specific age and sex groups. Note that the unstandardized values change with age. For example, the expected value of albumin and hemoglobin for a male aged between 60 and 65 years would be 4.2 g dL−1 and 15 mg L−1, respectively, while the expected value of albumin and hemoglobin for a male aged between 80 and 85 years would be 3.9 g dL−1 and 14.5 mg L−1, respectively (Fig. S2). LLFS, Long Life Family Study.
Figure 2
Figure 2
Age‐ and sex‐specific distribution of IL‐6 and hsCRP in LLFS participants, by cluster. Top: Age and sex distribution of IL‐6 in LLFS participants in cluster 1 (blue = males, red = females), and cluster 2 (cyan = male, magenta = females). Both inflammation markers are lower in cluster 2 than cluster 1 for all age groups. Bottom: Age and sex distribution of IL‐6 in LLFS participants in cluster 1 (blue = males, red = females), and cluster 5 (cyan = male, magenta = females). Both inflammation markers are substantially more elevated in cluster 5 than cluster 1 for all age groups. hsCRP, high‐sensitivity C‐reactive protein; LLFS, Long Life Family Study.
Figure 3
Figure 3
Association between biomarker signatures defined by 10 or more participants and physiological markers of aging. Top panel: Manhattan plot of the −log(P‐value) to test significant differences between physiological markers of aging comparing clusters with more than 20 subjects relative to cluster 1 (the referent group). Phenotypes are grip strength, gait speed, forced expiratory volume in 1 s (FEV1), scores of digital symbol substitution test (DSST) and Mini‐Mental State Examination (MMSE), pulse rate, and systolic blood pressure (sys BP). Horizontal lines represent the significance threshold based on Bonferroni correction. Bars above 0 represent increased effects relative to cluster 1, while bars below 0 represent decreased effects relative to cluster 1. For example, participants in cluster 2 have better gait speed, FEV1, DSST and MSE, and slower pulse rate compared to cluster 1, although only the difference of FEV1 remains significant after Bonferroni correction. Participants in cluster 5 have significantly slower gait speed, significantly lower FEV1 and MMSE, and faster pulse rate compared to cluster 1. Estimates of all 84 comparisons and p‐values are in Table S2. Bottom panel: Scatter plots of individual changes of gait speed and FEV1 between enrollment and the second in‐home visit colored by cluster membership (red: cluster 2; green: cluster 3; cyan: cluster 5). Each segment represents an individual change between age at enrollment and age at visit 2.

References

    1. Banerjee C, Ulloor J, Dillon EL, Dahodwala Q, Franklin B, Storer T, Sebastiani P, Sheffield‐Moore M, Urban RJ, Bhasin S, Montano M (2011) Identification of serum biomarkers for aging and anabolic response. Immun. Ageing 8, 5. - PMC - PubMed
    1. Belsky DW, Caspi A, Houts R, Cohen HJ, Corcoran DL, Danese A, Harrington H, Israel S, Levine ME, Schaefer JD, Sugden K, Williams B, Yashin AI, Poulton R, Moffitt TE (2015) Quantification of biological aging in young adults. Proc. Natl Acad. Sci. USA 112, E4104–E4110. - PMC - PubMed
    1. Bürkle A, Moreno‐Villanueva M, Bernhard J, Blasco M, Zondag G, Hoeijmakers JHJ, Toussaint O, Grubeck‐Loebenstein B, Mocchegiani E, Collino S, Gonos ES, Sikora E, Gradinaru D, Dollé M, Salmon M, Kristensen P, Griffiths HR, Libert C, Grune T, Breusing N, Simm A, Franceschi C, Capri M, Talbot D, Caiafa P, Friguet B, Slagboom PE, Hervonen A, Hurme M, Aspinall R (2015) MARK‐AGE biomarkers of ageing. Mech. Ageing Dev. 151, 2–12. - PubMed
    1. Catera M, Borelli V, Malagolini N, Chiricolo M, Venturi G, Reis CA, Osorio H, Abruzzo PM, Capri M, Monti D, Ostan R, Franceschi C, Dall'Olio, F (2016) Identification of novel plasma glycosylation‐associated markers of aging. Oncotarget 7, 7455–7468. - PMC - PubMed
    1. Cohen AA, Milot E, Li Q, Bergeron P, Poirier R, Dusseault‐Belanger F, Fulop T, Leroux M, Legault V, Metter EJ, Fried LP, Ferrucci L (2015) Detection of a novel, integrative aging process suggests complex physiological integration. PLoS One 10, e0116489. - PMC - PubMed

Publication types