

Improved cerebral energetics and ketone body metabolism in db/db mice
- PMID: 28058963
- PMCID: PMC5363491
- DOI: 10.1177/0271678X16684154
Improved cerebral energetics and ketone body metabolism in db/db mice
Abstract
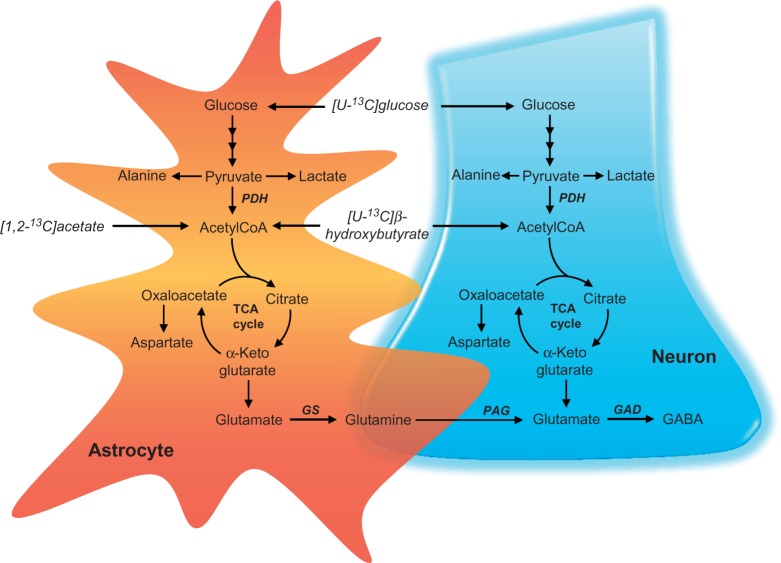
It is becoming evident that type 2 diabetes mellitus is affecting brain energy metabolism. The importance of alternative substrates for the brain in type 2 diabetes mellitus is poorly understood. The aim of this study was to investigate whether ketone bodies are relevant candidates to compensate for cerebral glucose hypometabolism and unravel the functionality of cerebral mitochondria in type 2 diabetes mellitus. Acutely isolated cerebral cortical and hippocampal slices of db/db mice were incubated in media containing [U-13C]glucose, [1,2-13C]acetate or [U-13C]β-hydroxybutyrate and tissue extracts were analysed by mass spectrometry. Oxygen consumption and ATP synthesis of brain mitochondria of db/db mice were assessed by Seahorse XFe96 and luciferin-luciferase assay, respectively. Glucose hypometabolism was observed for both cerebral cortical and hippocampal slices of db/db mice. Significant increased metabolism of [1,2-13C]acetate and [U-13C]β-hydroxybutyrate was observed for hippocampal slices of db/db mice. Furthermore, brain mitochondria of db/db mice exhibited elevated oxygen consumption and ATP synthesis rate. This study provides evidence of several changes in brain energy metabolism in type 2 diabetes mellitus. The increased hippocampal ketone body utilization and improved mitochondrial function in db/db mice, may act as adaptive mechanisms in order to maintain cerebral energetics during hampered glucose metabolism.
Keywords: Brain energy metabolism; db/db; ketone bodies; mitochondria; type 2 diabetes mellitus.
Figures


Similar articles
-
Impaired Hippocampal Glutamate and Glutamine Metabolism in the db/db Mouse Model of Type 2 Diabetes Mellitus.Neural Plast. 2017;2017:2107084. doi: 10.1155/2017/2107084. Epub 2017 Jun 14. Neural Plast. 2017. PMID: 28695014 Free PMC article.
-
Alterations in Cerebral Cortical Glucose and Glutamine Metabolism Precedes Amyloid Plaques in the APPswe/PSEN1dE9 Mouse Model of Alzheimer's Disease.Neurochem Res. 2017 Jun;42(6):1589-1598. doi: 10.1007/s11064-016-2070-2. Epub 2016 Sep 29. Neurochem Res. 2017. PMID: 27686658
-
Distinct differences in rates of oxygen consumption and ATP synthesis of regionally isolated non-synaptic mouse brain mitochondria.J Neurosci Res. 2019 Aug;97(8):961-974. doi: 10.1002/jnr.24371. Epub 2019 Jan 24. J Neurosci Res. 2019. PMID: 30675904
-
Effects of ketone bodies in Alzheimer's disease in relation to neural hypometabolism, β-amyloid toxicity, and astrocyte function.J Neurochem. 2015 Jul;134(1):7-20. doi: 10.1111/jnc.13107. Epub 2015 Apr 23. J Neurochem. 2015. PMID: 25832906 Review.
-
Brain uptake and metabolism of ketone bodies in animal models.Prostaglandins Leukot Essent Fatty Acids. 2004 Mar;70(3):265-75. doi: 10.1016/j.plefa.2003.07.006. Prostaglandins Leukot Essent Fatty Acids. 2004. PMID: 14769485 Review.
Cited by
-
The gut microbiota-astrocyte axis: Implications for type 2 diabetic cognitive dysfunction.CNS Neurosci Ther. 2023 Jun;29 Suppl 1(Suppl 1):59-73. doi: 10.1111/cns.14077. Epub 2023 Jan 4. CNS Neurosci Ther. 2023. PMID: 36601656 Free PMC article. Review.
-
Fats, Friends or Foes: Investigating the Role of Short- and Medium-Chain Fatty Acids in Alzheimer's Disease.Biomedicines. 2022 Nov 1;10(11):2778. doi: 10.3390/biomedicines10112778. Biomedicines. 2022. PMID: 36359298 Free PMC article. Review.
-
Effects of aging, hypertension and diabetes on the mouse brain and heart vasculomes.Neurobiol Dis. 2019 Jun;126:117-123. doi: 10.1016/j.nbd.2018.07.021. Epub 2018 Jul 19. Neurobiol Dis. 2019. PMID: 30031157 Free PMC article.
-
Impaired Hippocampal Glutamate and Glutamine Metabolism in the db/db Mouse Model of Type 2 Diabetes Mellitus.Neural Plast. 2017;2017:2107084. doi: 10.1155/2017/2107084. Epub 2017 Jun 14. Neural Plast. 2017. PMID: 28695014 Free PMC article.
-
Deletion of Neuronal GLT-1 in Mice Reveals Its Role in Synaptic Glutamate Homeostasis and Mitochondrial Function.J Neurosci. 2019 Jun 19;39(25):4847-4863. doi: 10.1523/JNEUROSCI.0894-18.2019. Epub 2019 Mar 29. J Neurosci. 2019. PMID: 30926746 Free PMC article.
References
-
- World Health Organization. Global report on diabetes, Geneva, Switzerland: WHO Press, 2016.
-
- Ott A, Stolk RP, Hofman A, et al. Association of diabetes mellitus and dementia: the Rotterdam Study. Diabetologia 1996; 39: 1392–1397. - PubMed
MeSH terms
Substances
LinkOut - more resources
Full Text Sources
Other Literature Sources
Medical
Miscellaneous
