Structural Effects of Lanthanide Dopants on Alumina
- PMID: 28059121
- PMCID: PMC5216414
- DOI: 10.1038/srep39946
Structural Effects of Lanthanide Dopants on Alumina
Abstract
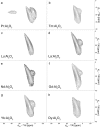
Lanthanide (Ln3+) doping in alumina has shown great promise for stabilizing and promoting desirable phase formation to achieve optimized physical and chemical properties. However, doping alumina with Ln elements is generally accompanied by formation of new phases (i.e. LnAlO3, Ln2O3), and therefore inclusion of Ln-doping mechanisms for phase stabilization of the alumina lattice is indispensable. In this study, Ln-doping (400 ppm) of the alumina lattice crucially delays the onset of phase transformation and enables phase population control, which is achieved without the formation of new phases. The delay in phase transition (θ → α), and alteration of powder morphology, particle dimensions, and composition ratios between α- and θ-alumina phases are studied using a combination of solid state nuclear magnetic resonance, electron microscopy, digital scanning calorimetry, and high resolution X-ray diffraction with refinement fitting. Loading alumina with a sparse concentration of Ln-dopants suggests that the dopants reside in the vacant octahedral locations within the alumina lattice, where complete conversion into the thermodynamically stable α-domain is shown in dysprosium (Dy)- and lutetium (Lu)-doped alumina. This study opens up the potential to control the structure and phase composition of Ln-doped alumina for emerging applications.
Figures


References
-
- Levin I. & Brandon D. Metastable alumina polymorphs: Crystal structures and transition sequences. Journal of the American Ceramic Society 81, 1995–2012 (1998).
-
- Loong C. K., Richardson J. W. & Ozawa M. Structural phase transformations of rare-earth modified transition alumina to corundum. Journal of Alloys and Compounds 250, 356–359 (1997).
-
- Chahrour K. M., Ahmed N. M., Hashim M. R., Elfadill N. G. & Bououdina M. Self-assembly of aligned CuO nanorod arrays using nanoporous anodic alumina template by electrodeposition on Si substrate for IR photodetectors. Sensors and Actuators a-Physical 239, 209–219 (2016).
-
- Huang D., Wu Z. & Sunden B. Effects of hybrid nanofluid mixture in plate heat exchangers. Experimental Thermal and Fluid Science 72, 190–196 (2016).
-
- Singh S., Jena S. K. & Das B. Application of pyrophyllite mine waste for the removal of cadmium and lead ions from aqueous solutions. Desalination and Water Treatment 57, 8952–8966 (2016).
Publication types
LinkOut - more resources
Full Text Sources
Other Literature Sources
Miscellaneous

