. 2017 Jan 6:7:39981.
doi: 10.1038/srep39981.

Neuronal apoptosis inhibitory protein (NAIP) localizes to the cytokinetic machinery during cell division

Affiliations

Neuronal apoptosis inhibitory protein (NAIP) localizes to the cytokinetic machinery during cell division

Francisco Abadía-Molina et al. Sci Rep. .

Abstract

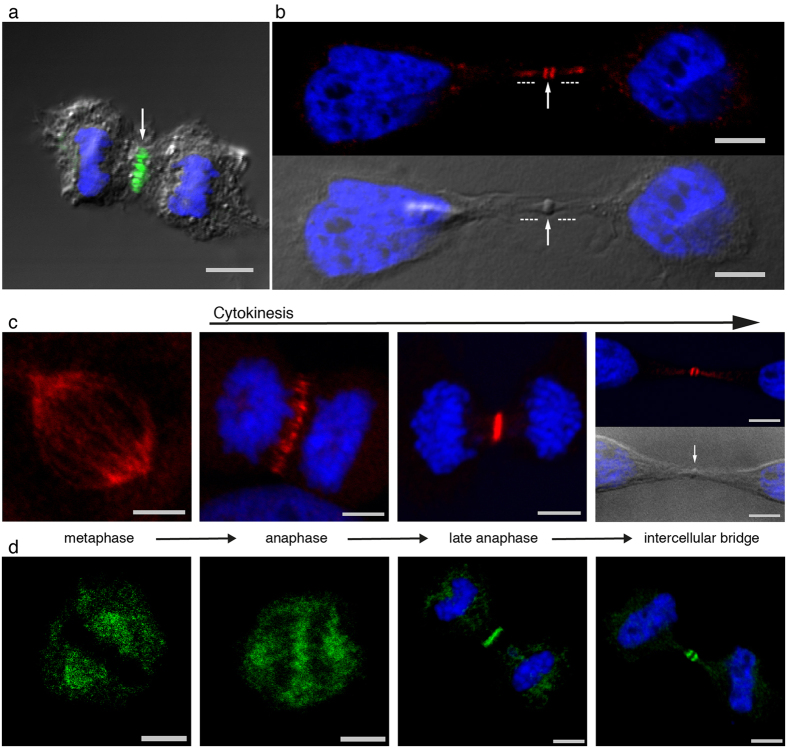
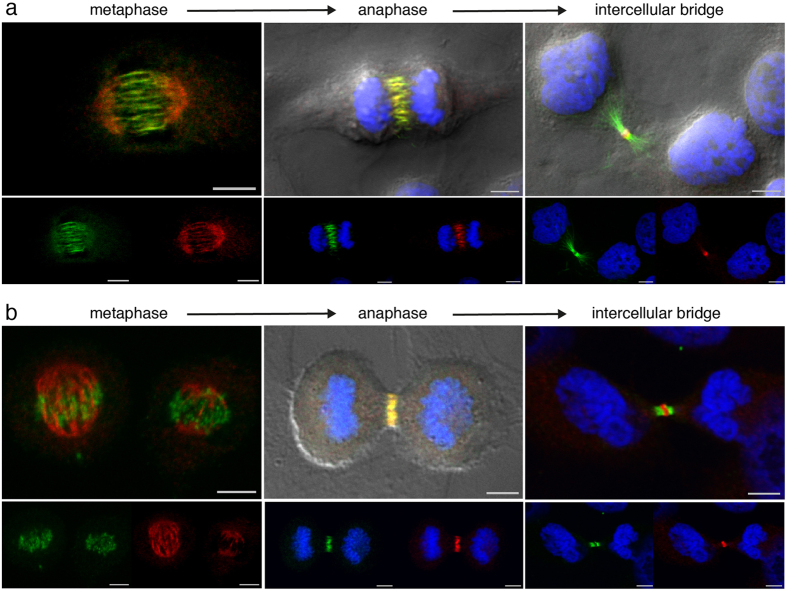
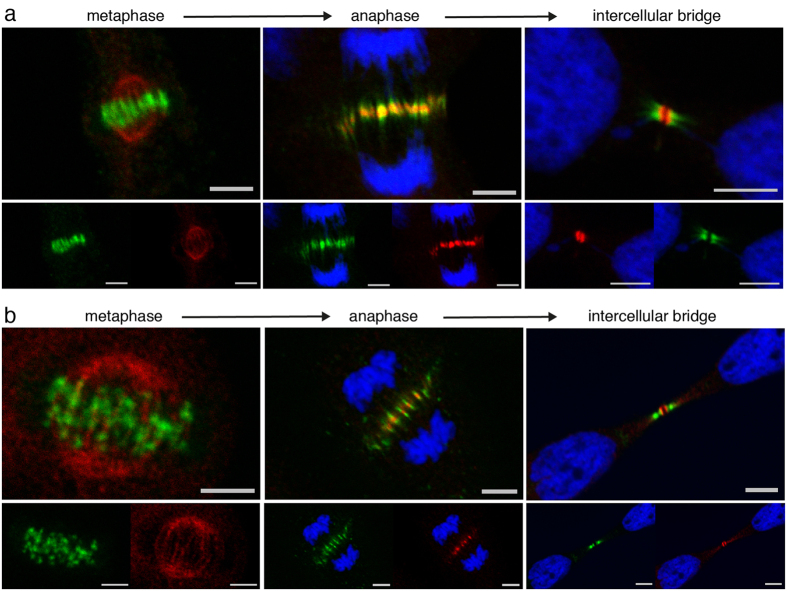
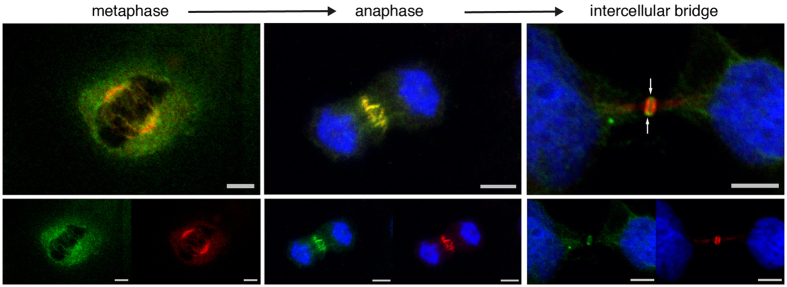
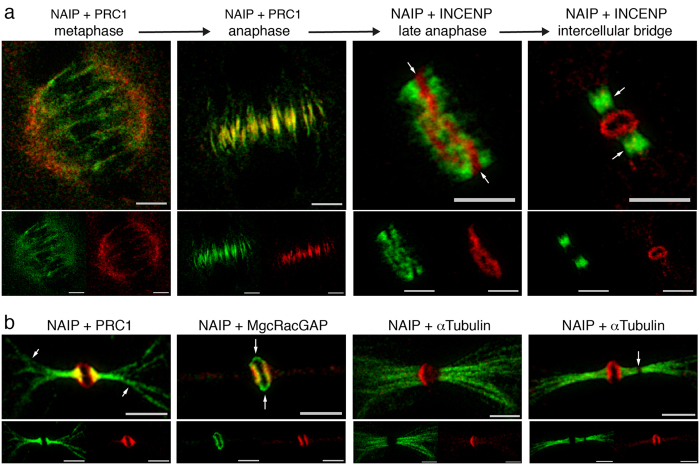
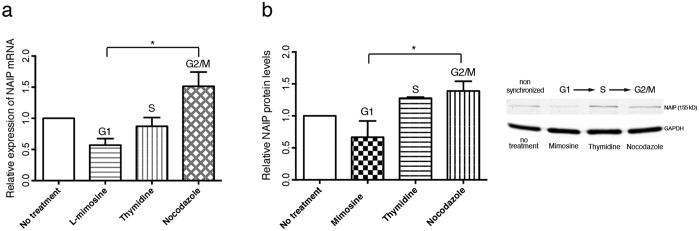
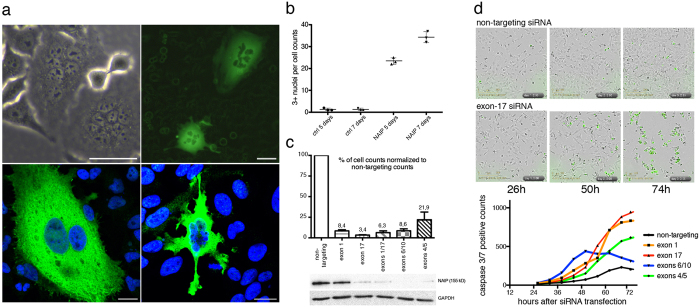
The neuronal apoptosis inhibitory protein (NAIP) is a constituent of the inflammasome and a key component of the innate immune system. Here we use immunofluorescence to position NAIP within the cytokinetic apparatus, contiguous to chromosomal passenger complex (CPC), Centralspindlin, PRC1 and KIF4A. During metaphase, NAIP accumulates in the mitotic spindle poles and is shown in spindle microtubules; in anaphase NAIP is detected in the middle of the central spindle. At the end of cytokinesis, NAIP is localized in the outlying region of the stem body, the center of the intercellular bridge formed between daughter cells prior to cellular abscission. We also describe the sustained presence of NAIP mRNA and protein throughout the cell cycle with a significant increase observed in the G2/M phase. Consistent with a role for NAIP in cytokinesis, NAIP overexpression in HeLa cells promotes the acquisition of a multinuclear phenotype. Conversely, NAIP siRNA gene silencing results in an apoptotic lethal phenotype. Our confocal and super resolution stimulated-emission-depletion (STED) examination of mammalian cell cytokinesis demonstrate a potential new role for NAIP in addition to anti-apoptotic and innate immunology functions.


Figures

Figure 1
Figure 1. NAIP dynamics in cytokinesis.
Confocal differential interference contrast, nuclear Hoechst staining and NAIP immunofluorescence channels merged accordingly. In the metaphase images and in one anaphase image the Hoechst channel has been omitted for clarity. In (a),(b) and (c) NAIP immunostaing was performed with an antibody mapping to 13 C-terminal amino acids of human NAIP (abcam, ab25968). (a) Anaphase showing NAIP immunofluorescence in the central spindle (arrow), the staining corresponds with the antiparallel microtubule plus-ends intersection area at the central spindle. (b) Intercellular bridge showing NAIP immunofluorescence in the outer regions of the stem body (arrow) and in the flanking zone of the stem body (dashed lines). The intercellular bridge can be subdivided into three known areas; the central stem body, the upper and lower portions of stem body, also referred as the bulge, and the flanking region. (c) NAIP dynamics during cytokinesis. NAIP accumulates in the spindle poles in metaphase and is also shown in spindle microtubules, later, once cytokinesis has started, NAIP is restricted to the middle of the central spindle gradually concentrating along the cell division plane as the cleavage furrow progressively constricts the dividing cell. Near cytokinesis completion, NAIP is present in the outflanking regions of the stem body (arrow) in the center of the intercellular bridge. (d) NAIP in cytokinesis demonstrated with a different NAIP antibody. NAIP immunofluorescence performed with a commercial polyclonal antibody, epitope mapping to the first 100 residues of human NAIP (abcam, ab98020), showing a pattern as described in (c). Bar, 5 μm.
Figure 2
Figure 2. NAIP and the central spindle bundling factors PRC1 and KIF4A.
Confocal differential interference contrast, Hoechst DNA staining, PRC1 or KIF4A (Alexa Fluor-488 shown in green) and NAIP abcam ab25968 (Alexa Fluor-568 shown in red), both individual and merged channels. In the metaphase images the Hoechst channel has been omitted for clarity. (a) PRC1 and NAIP double immunostaining in metaphase showing a predominant presence of NAIP in the spindle poles and PRC1 clearly decorating spindle microtubules. A complete PRC1 and NAIP central spindle colocalization is shown in anaphase. Once the intercellular bridge is formed, PRC1 and NAIP have segregated into the flanking regions and the stem body respectively. (b) KIF4A and NAIP double immunostaining showing a distribution as described in (a) but with a minor presence of KIF4A in the two metaphase spindles shown as well as in the intercellular bridge arms. Bar, 5 μm.
Figure 3
Figure 3. NAIP and the chromosomal passenger complex (CPC).
Hoechst DNA staining, Aurora B or INCENP (Alexa Fluor-488 shown in green) and NAIP abcam ab25968 (Alexa Fluor-568 shown in red) individual and merged confocal channels. In the metaphase images the Hoechst channel has been omitted for clarity. (a) Aurora B and NAIP double immunostaining: in metaphase Aurora B is localized to the metaphase plate area while NAIP accumulates in the spindle poles, during anaphase Aurora B is localized in the middle of the central spindle while NAIP is present in the centermost zone. In the intercellular bridge, Aurora B is present in the flanking zone and NAIP localizes to the outer area of the stem body. (b) INCENP and NAIP double immunostaining showing a pattern as described in (a), in metaphase INCENP immunofluorecence clearly depicts mitotic chromosomal centromeres and in anaphase maps to the sides of NAIP immunofluorescence. NAIP and survivin double immunostainings, omitted here for brevity, are shown in the Supplementary information (Fig. S2). Bar, 5 μm.
Figure 4
Figure 4. NAIP and Centralspindlin.
Hoechst DNA staining, MgcRacGAP (Alexa Fluor-488 shown in green) and NAIP abcam ab25968 (Alexa Fluor-568 shown in red) confocal channels individually and merged. The Hoechst channel has been omitted in the metaphase images for clarity. In metaphase and anaphase, MgcRacGAP and NAIP largely colocalize (orange in the upper merged images), while in the intercellular bridge MgcRagGAP is predominantly shown in the bulge (arrows) and NAIP is detected in the stem body flanks. Bar, 5 μm.
Figure 5
Figure 5. STED microscopy.
Dual STED microscopy for NAIP abcam ab25968 (Chromeo-505 fluorescence shown in red) and PRC1, INCENP or α-Tubulin (Biotin fluorescence shown in green), STED channels merged accordingly. (a) Image series showing the distribution of NAIP at individual phases along the cytokinesis timeline in conjunction with well characterized cytokinesis regulators. Before cytokinesis initiation, in metaphase, NAIP is primarily visualized in the spindle poles, while the microtubule stabilizers (PRC1, KIF4A) and Centralspindlin are observed in spindle microtubules. In anaphase, NAIP immunostaining occupies the center of the central spindle, colocalizes with PRC1, KIF4A, the CPC components and Centralspindlin. Gradual ingression of the cleavage furrow constricts the central spindle into a ring in which NAIP occupies the centermost section (arrows) and colocalizes with MgcRacGAP, while PRC1, KIF4A and CPC have segregated to both sides of NAIP (late anaphase). Then, when the intercellular bridge is completely formed, NAIP is present in the bulge along with MgcRacGAP while the microtubule stabilizers and CPC localize to the intercellular bridge flanking area. (b) NAIP + PRC1: NAIP immunofluorescence is shown in the outer stem body area while PRC1 extends on both sides from the intercellular bridge center well beyond the flanking zone and into the nascent daughter cells (arrows). NAIP + MgcRacGAP: Both proteins are shown delimiting the stem body margins, interestingly MgcRacGAP occupies the upper and lower portions of the stem body precisely (arrows). NAIP + α-Tubulin: An array of microtubule bundles is shown lengthening at both sides on the intercellular bridge center, an abscission point can be identified as a disruption lacking any immunostaining (arrow). Bar, 2, 5 μm.
Figure 6
Figure 6. NAIP expression along the cell-cycle.
(a) NAIP mRNA relative expression in exponentially growing (no treatment) or drug synchronized HeLa cells (400 μM L-mimosine, G1; 2 mM thymidine, S; 0, 4 μg ml−1 nocodazole, G2/M). (b) NAIP protein levels and representative western blot of non-treated, G1, S and G2/M synchronized HeLa cells. *Significant difference (P < 0.02). Data are the mean ± s.d. of three independent determinations.
Figure 7
Figure 7. NAIP overexpression and loss of function.
(a) Upper panel: Phase-contrast and fluorescence live microscopy images of HeLa cells 7 days after transduction with ‘NAIP + neo’ or ‘NAIP + GFP’ lentiviral particles respectively. Non transduced cells surrounding the multinuclear fluorescent ‘NAIP + GFP’ transduced cells show a faint green glow profile. Bar, 50 μm. Lower panel: NAIP immunostaining with abcam ab25968 of HeLa cells (Alexa Fluor-488) 7 days after transduction with ‘NAIP + neo’ lentiviral particles demonstrating that the multinuclear phenotype is observed in cells overexpressing NAIP. Bar, 20 μm. (b) Total visual counts of HeLa cells with three or more nuclei in four randomly selected 10X optical fields from control (non-transduced) and ‘NAIP + neo’ transduced HeLa cells 5 and 7 days after transduction. Data are the mean ± s.d. of three independent transductions. (c) Percentage of cells remaining in culture three days after transfection with various combinations of NAIP siRNA duplexes targeting the indicated NAIP mRNA exons and western blot showing the corresponding efficacy in NAIP silencing. Data are the mean ± s.d. of three independent determinations. (d) Upper panels: Phase-contrast and green-fluorescence IncuCyte ZOOM merged images of non-targeting and NAIP exon17-siRNA transfections taken 26, 50 and 74 hours after siRNA transfection. Fluorescent cells show active caspase-3/7, a reflection of the processing of a non-fluorescent caspase-3/7 substrate releasing a green fluorescent dye. Lower graph: Apoptotic cell counts 26 to 74 hours after NAIP siRNA transfection. Each point represents the mean of the caspase-3/7 counts for 4 different optic fields analyzed per well and treatment at a given time point. The graph is representative of one out of four replicas of two independent siRNA transfections.

References

    1. D’Avino P. P., Giansanti M. G. & Petronczki M. Cytokinesis in animal cells. Cold Spring Harbor perspectives in biology 7, a015834 (2015). - PMC - PubMed
    1. Fededa J. P. & Gerlich D. W. Molecular control of animal cell cytokinesis. Nature Cell Biology 14, 440–447 (2012). - PubMed
    1. Pollard T. D. Mechanics of cytokinesis in eukaryotes. Current Opinion in Cell Biology 22, 50–56 (2010). - PMC - PubMed
    1. Roy N. et al.. The gene for neuronal apoptosis inhibitory protein is partially deleted in individuals with spinal muscular atrophy. Cell 80, 167–178 (1995). - PubMed
    1. Liston P. et al.. Suppression of apoptosis in mammalian cells by naip and a related family of iap genes. Nature 379, 349–353 (1996). - PubMed

Publication types

Grants and funding