. 2017 Jan 6:6:e21843.
doi: 10.7554/eLife.21843.

Feedforward motor information enhances somatosensory responses and sharpens angular tuning of rat S1 barrel cortex neurons

Affiliations

Feedforward motor information enhances somatosensory responses and sharpens angular tuning of rat S1 barrel cortex neurons

Mohamed Khateb et al. Elife. .

Abstract

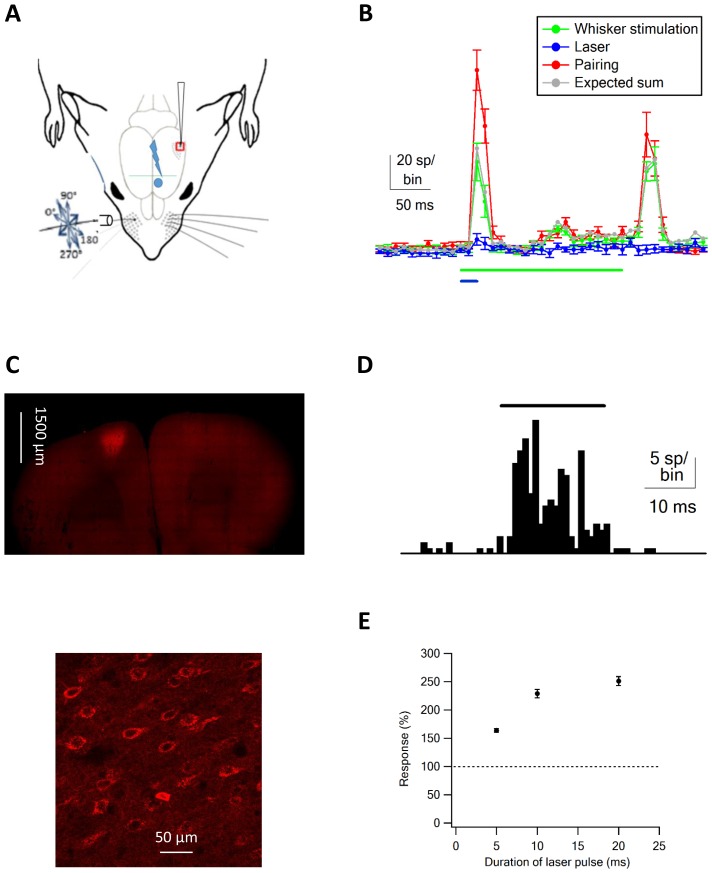
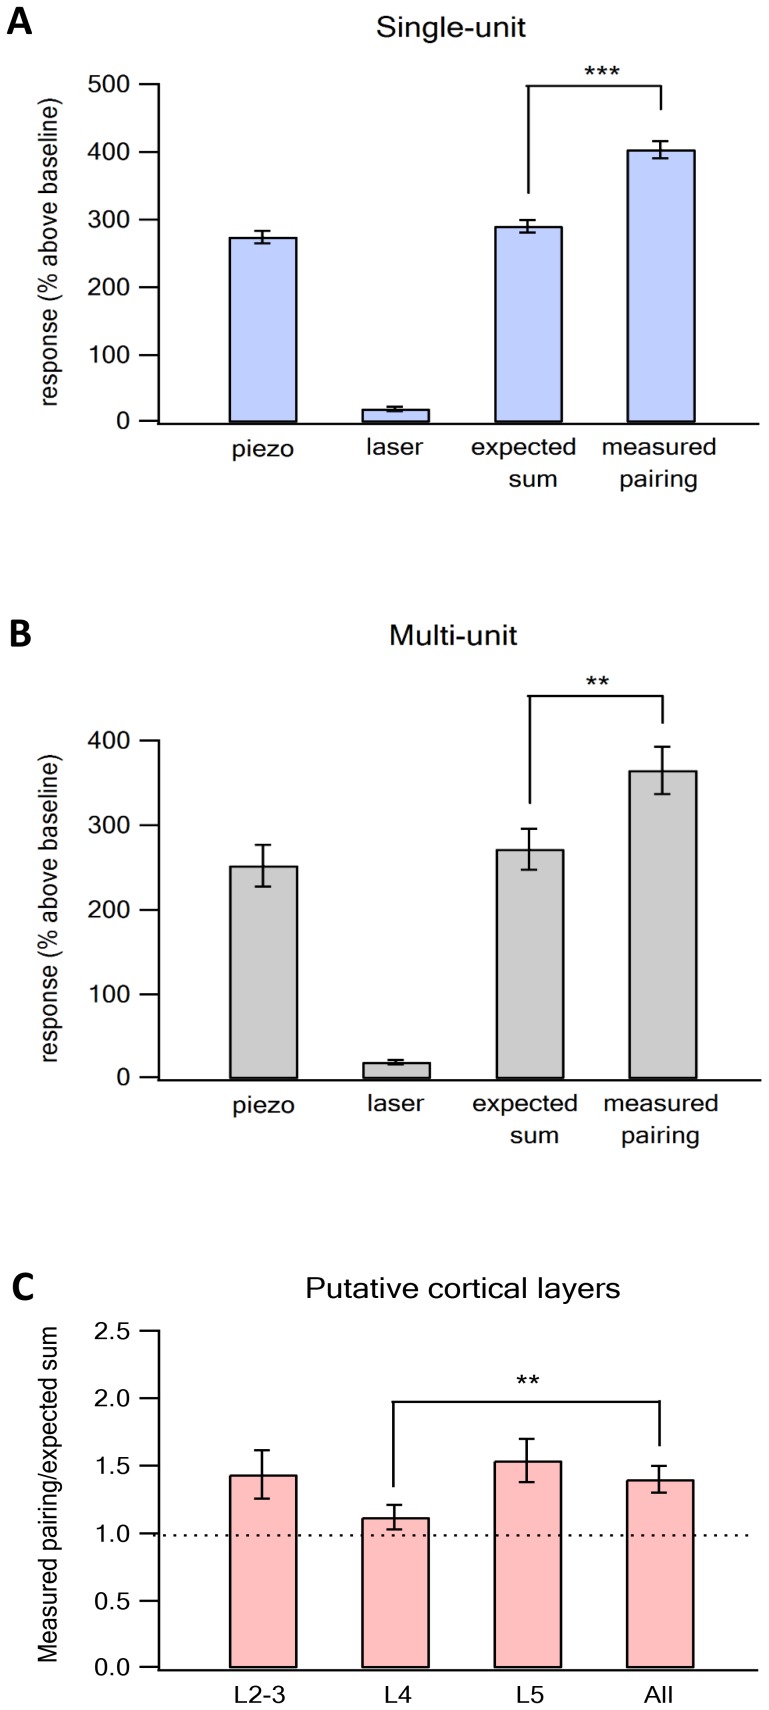
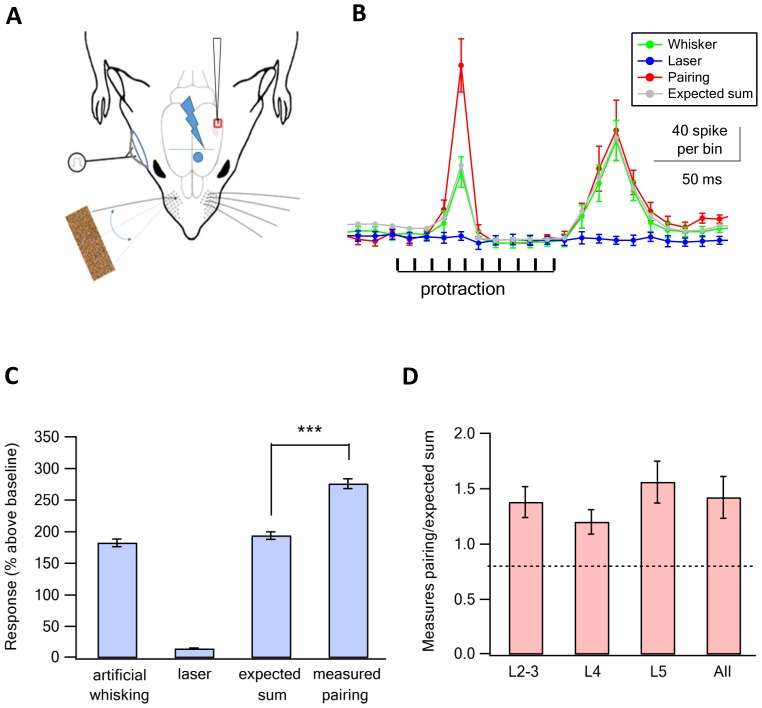
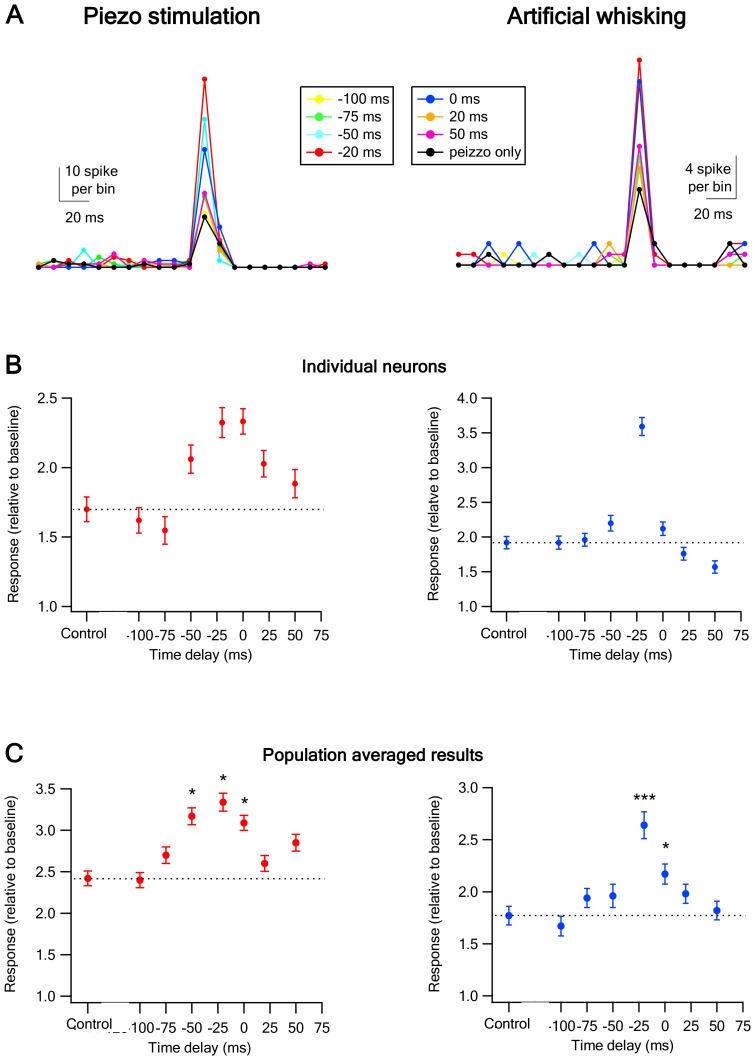
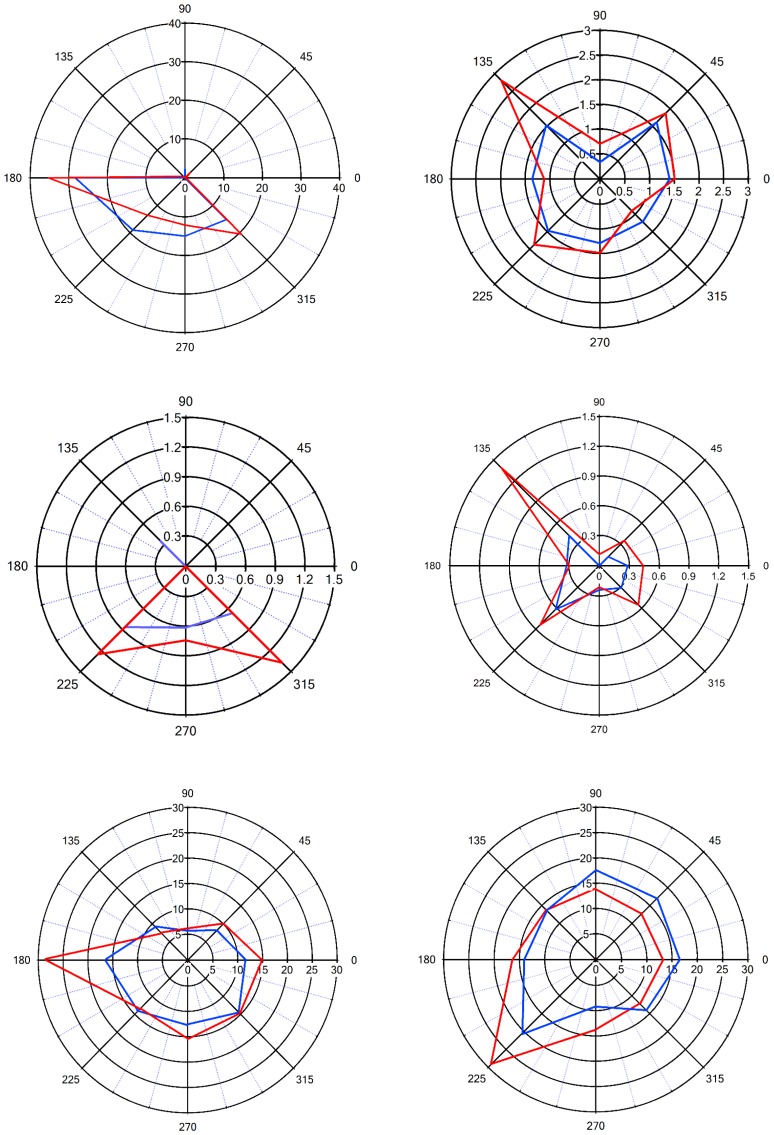
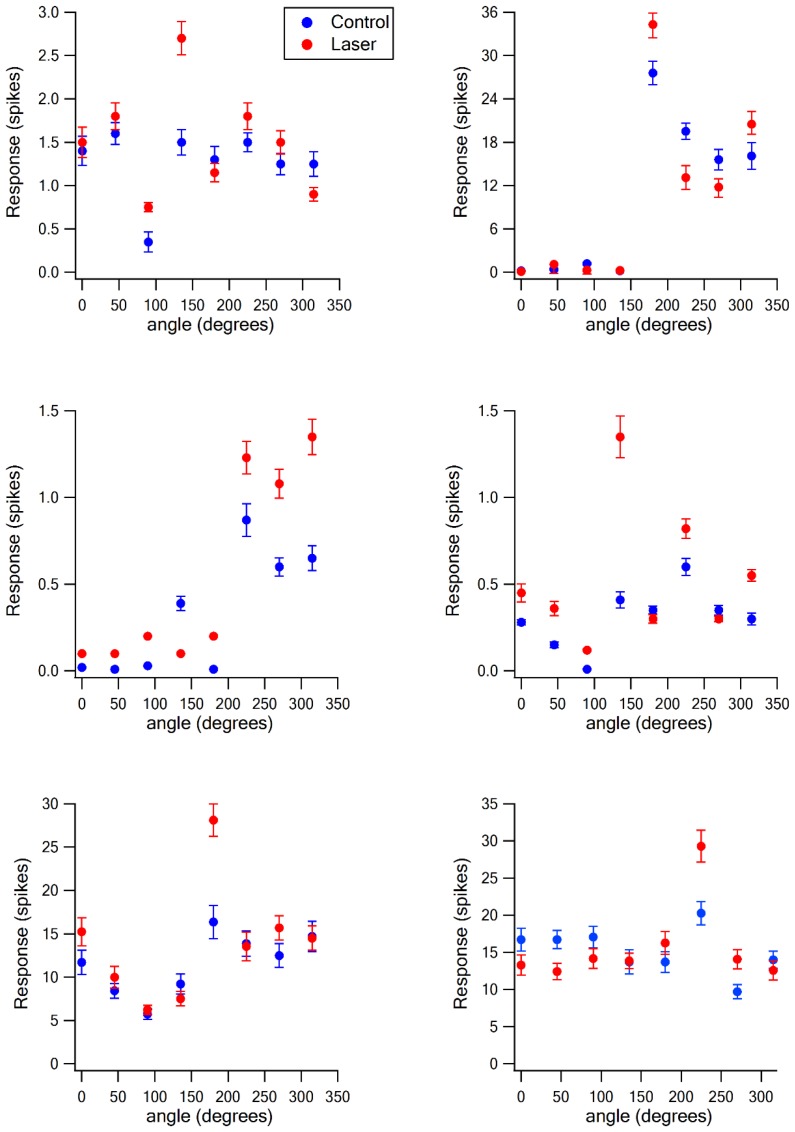
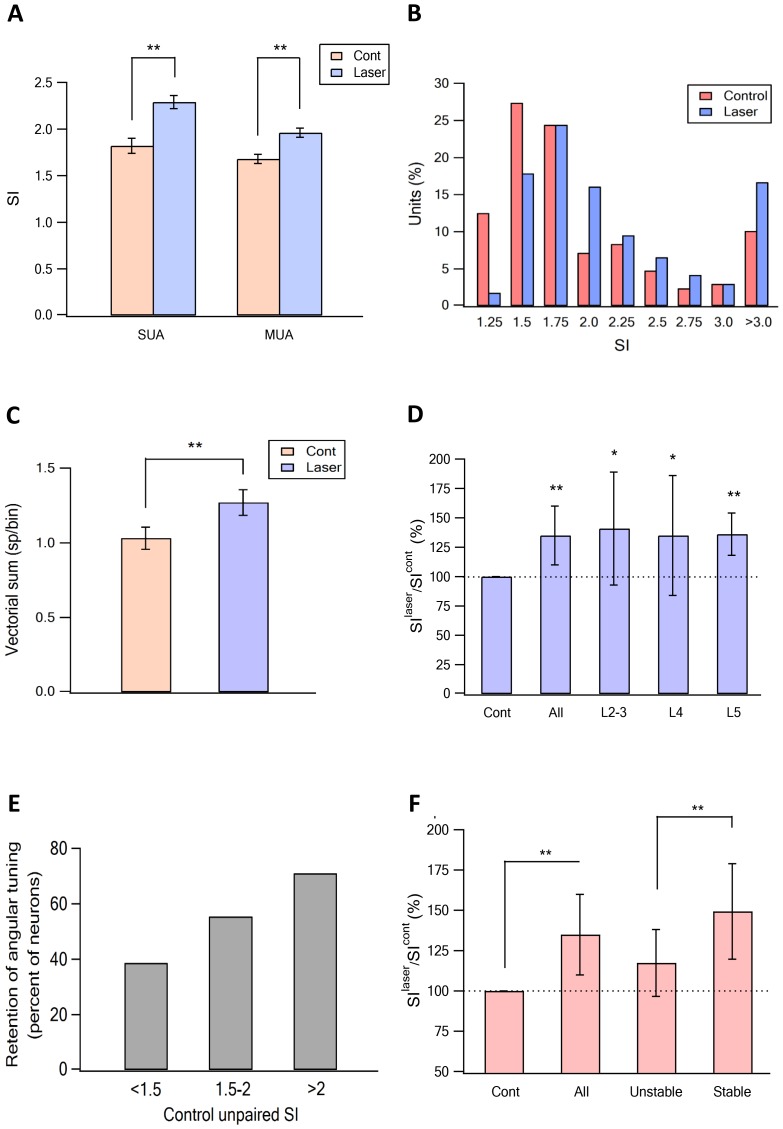
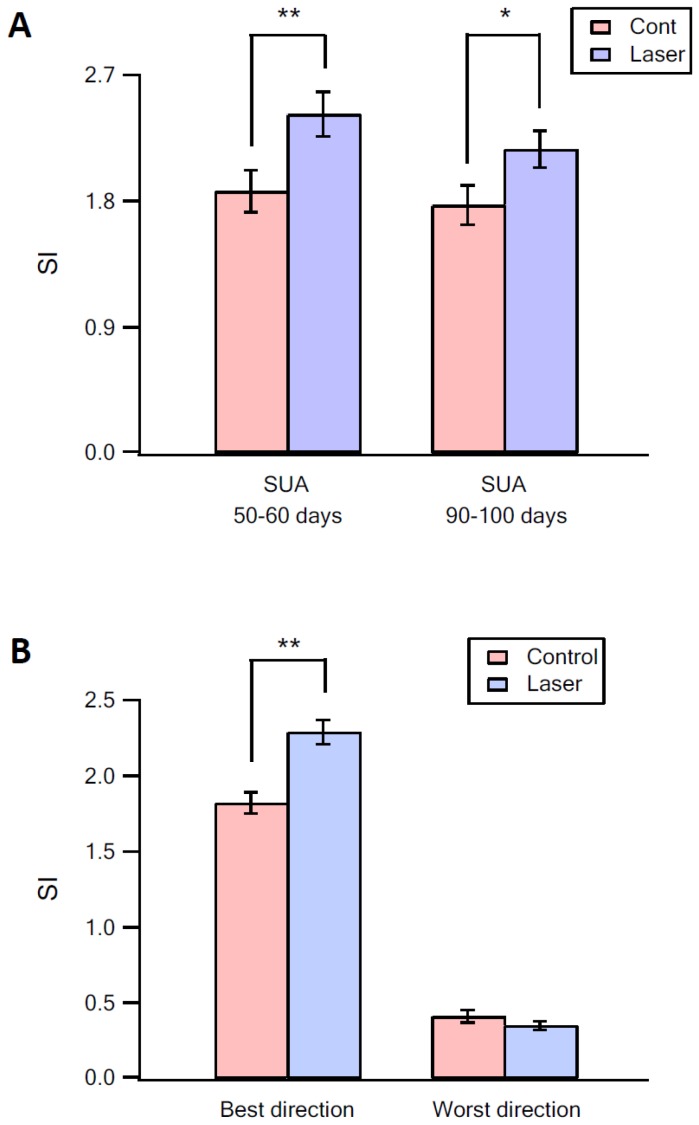
The primary vibrissae motor cortex (vM1) is responsible for generating whisking movements. In parallel, vM1 also sends information directly to the sensory barrel cortex (vS1). In this study, we investigated the effects of vM1 activation on processing of vibrissae sensory information in vS1 of the rat. To dissociate the vibrissae sensory-motor loop, we optogenetically activated vM1 and independently passively stimulated principal vibrissae. Optogenetic activation of vM1 supra-linearly amplified the response of vS1 neurons to passive vibrissa stimulation in all cortical layers measured. Maximal amplification occurred when onset of vM1 optogenetic activation preceded vibrissa stimulation by 20 ms. In addition to amplification, vM1 activation also sharpened angular tuning of vS1 neurons in all cortical layers measured. Our findings indicated that in addition to output motor signals, vM1 also sends preparatory signals to vS1 that serve to amplify and sharpen the response of neurons in the barrel cortex to incoming sensory input signals.

Keywords: Barrel cortex; Whiskers; neuroscience; primary motor cortex; rat; sensory-motor loop.


Conflict of interest statement

The authors declare that no competing interests exist.

Figures

Figure 1.
Figure 1.. Optogenetic vM1 activation and passive ramp and hold vibrissa deflection.
(A) Scheme of the experimental design with the recording electrode in vS1, optogenetic stimulation of vM1 and ramp and hold passive vibrissa deflection. (B) Peri-stimulus histograms (PSTH, mean ± SEM) recorded from a vS1 neuron during isolated vM1 optogenetic stimulation (blue), isolated passive vibrissa deflection (green), and paired vM1-vibrissa stimulation (red). In addition, the expected linear sum of the solitary vM1 stimulation and vibrissa deflection is shown (gray). (C) Fluorescence images at different magnifications of neurons co-expressing ChR2 and mCherry. (D) PSTH recorded from a vM1 neuron during optogenetic stimulation (473 nm laser pulse). (E) Average (mean ± SEM) responses recorded in vS1 neurons during optogenetic stimulation of vM1 with laser pulse duration (147 neurons in four rats). In each neurons, the spike count responses during optohgenetic stimulation were presented as percent of the spike count during the pre-stimulus control value. Later, the responses were averaged over the different neurons. DOI: http://dx.doi.org/10.7554/eLife.21843.002
Figure 1—figure supplement 1.
Figure 1—figure supplement 1.. Raw data of unit recordings.
Four separate traces of raw recording filtered at 1–5 kHz. Each trace shows simultaneous recordings from eight different channels. DOI: http://dx.doi.org/10.7554/eLife.21843.003
Figure 1—figure supplement 2.
Figure 1—figure supplement 2.. Raw clustering data.
The raw clustering data is presented for ten individual electrodes, which yielded 26 individual sorted units. For each electrode, we present the putative layer, the 2D principal components graph, the mean ± SD of each unit and the clustering statistical parameters. DOI: http://dx.doi.org/10.7554/eLife.21843.004
Figure 1—figure supplement 3.
Figure 1—figure supplement 3.. Piezo bimorph movement.
The movement of the piezo bimorph was monitored during a ramp and hold stimulation pulse using a high-speed camera (1000 fps). Panel A shows individual traces of piezo bimorph movement after applying different values to the smoothening factor (0.03–1). Panel B presents the average amplitude of the maximal ringing (measured from peak to turf) with the different smoothening factor values. DOI: http://dx.doi.org/10.7554/eLife.21843.005
Figure 2.
Figure 2.. Supra-linear summation of paired optogenetic vM1 activation and passive ramp and hold vibrissa deflection-averaged results.
Average (mean ± SEM) single-unit response (presented as percent above the pre-stimulus control activity) of vS1 neurons to the On response during the different stimulation conditions, isolated vM1 optogenetic stimulation, isolated passive vibrissa deflection, expected linear sum of the solitary vM1 stimulation and vibrissa deflection and paired vM1-vibrissa stimulation presented for single-unit analysis (A) and multi-unit analysis (B), (237 units from 91 electrode contacts in seven rats). Note that the recorded activity during paired vM1-vibrissa stimulation was significantly larger than the linear sum of the response to vM1 activation and passive ramp and hold vibrissa deflection applied separately for both single- and multi-unit analyses. (C) Average (mean ± SEM) supra-linearity of the paired vM1-vibrissa stimulation response (measured/expected linear sum) presented for all neurons and for neurons in the different putative neocortical layers (2–3, 4 and 5). Thirty-five neurons from putative layers 2–3, 79 neurons from putative layer 4 and 123 neurons in putative layer 5. ***p<0.001 and **p<0.01 using the student's t-test. DOI: http://dx.doi.org/10.7554/eLife.21843.006
Figure 3.
Figure 3.. Supra-linear summation of paired optogenetic vM1 activation and artificial whisking against sandpaper.
(A) Scheme of the experimental design with the recording electrode in vS1, optogenetic stimulation of vM1 and artificial whisking against sandpaper by electrically stimulating the buccolabialis nerve. The timing of individual nerve stimulation and protraction phase is marked in black. (B) Peri-stimulus histograms (PSTH, mean ± SEM) recorded from a vS1 neuron during solitary vM1 optogenetic stimulation (blue), solitary artificial whisking against sandpaper (green), and paired vM1-vibrissa stimulation (red). In addition, the expected linear sum of the solitary vM1 stimulation and artificial whisking is shown (gray). (C) Average (mean ± SEM) responses (presented as percent above the pre-stimulus control activity) of vS1 neurons to the different stimulation conditions (294 neurons from six rats). Note that the recorded activity during paired vM1-vibrissa stimulation was significantly larger than the linear sum of the response to solitary vM1 activation and artificial whisking. ***p<0.001 with the paired student's t-test. (D) Average (mean ± SEM) supra-linearity of the paired vM1-vibrissa stimulation response (measured/expected linear sum) presented for all neurons and for neurons in the different putative neocortical layers, 76 neurons from putative layers 2–3, 80 neurons from putative layer 4 and 138 neurons in putative layer 5. DOI: http://dx.doi.org/10.7554/eLife.21843.007
Figure 4.
Figure 4.. Temporal rules governing the interactions between of vM1 activation and vibrissa stimulation on the response of vS1 barrel cortex neurons.
(A) The peak of the peri-stimulus histograms (PSTH) recorded from individual vS1 neurons during paired vM1-vibrissa stimulation with different time lags between the vM1 optogenetic activation (20 ms laser pulse) and vibrissa stimulation (−100 ms up to +50 ms). The time lags were calculated by subtracting the onset time of vibrissa stimulation from the onset time of vM1 optogenetic activation. The data are presented for two different individual neurons during passive ramp and hold vibrissa deflection (left panel) and artificial whisking against sandpaper (right panel). (B) The response (mean ± SEM) of two different individual vS1 neurons to paired vM1-vibrissa stimulation applied with different inter-stimuli time lags between the optogenetic and vibrissa deflection. In the left panel, the vibrissa was stimulated with a ramp and hold vibrissa deflection, and in the right panel, the vibrissa was stimulated with artificial whisking against a P320 sand paper. (C) The average (mean ± SEM) response of all recorded vS1 neurons to isolated passive vibrissa stimulation (control) and paired vM1-vibrissa stimulation applied with different inter-stimuli time lags. For both B and C, the data are presented for passive ramp and hold vibrissa deflection (left panels) and artificial whisking against sandpaper (right panels). 238 neurons from six rats for vibrissa deflection experiments; 334 neurons from seven rats in the artificial whisking experiments; *p<0.05, ***p<0.001. DOI: http://dx.doi.org/10.7554/eLife.21843.008
Figure 5.
Figure 5.. Sharpening of the angular tuning of vS1 by paired vM1 activation: examples of individual neurons.
Polar plots of six individual vS1 neurons during isolated ramp and hold vibrissa deflection (blue) and paired vM1-vibrissa stimulation (red). In these experiments, the principal vibrissa was randomly deflected to eight different directions (0°,43°,90°, 135°, 180°, 225°,270°, 315°) with and without paired vM1 optogenetic activation. Vibrissae were deflected in the different directions by two pairs of galvanometers. Upper four panels are from 50–60 day old rats, and the lower two panels are from 90–100 day old rats. Upper left panel-putative layer 2–3, upper right panel putative layer 5, middle left panel-putative layer 4, middle right panel putative layer 5, lower left panel-putative layer 5, lower right panel putative layer 2–3. Note, sharpening of the angular tuning curve following paired vM1 optogenetic activation. DOI: http://dx.doi.org/10.7554/eLife.21843.009
Figure 5—figure supplement 1.
Figure 5—figure supplement 1.. The effect of vM1 activation on the angular tuning of individual neurons.
The response (mean ± SEM) of six individual neurons to ramp and hold vibrissa deflection in eight different angles under control conditions and during optogenetic co-activation of vM1. The neurons are the same neurons presented in Figure 5. In this figure, we present the data in conventional graphs rather than polar plots, and add the variability of the responses (SEM). DOI: http://dx.doi.org/10.7554/eLife.21843.010
Figure 6.
Figure 6.. Sharpening of the angular tuning of vS1 by paired vM1 activation: averaged results.
(A) The average (mean ± SEM) ratio between the SI calculated for the preferred angular direction for isolated vibrissa deflection (red) and paired vibrissa deflection with vM1 optogenetic activation (blue). The results are presented for single- (SUA) and multi-unit (MUA) analysis. The results are shown for all neurons examine (304 neurons from 11 rats). Note the significant increase in the SI following pairing with vM1 activation for moth SUA and MUA. (B) The SI magnitude histogram of unit for isolated for isolated vibrissa deflection (red) and paired vibrissa deflection with vM1 optogenetic activation (blue). Note that paired vM1 optogenetic stimulation resulted a right shift of the histogram. (C) The effect of vM1 optogenetic activation on the average amplitude (mean ± SEM) of the vector sum. Vector sum analysis was performed on the same data set presented in panels A and B (204 neurons from 11 rats). **p<0.01. (D) The average (mean ± SEM) ratio between the SI calculated for isolated vibrissa deflection and paired vibrissa deflection with vM1 optogenetic activation. The results are shown for all neurons examine, and for the different putative cortical layers (25.7% putative layer 2–3 neurons, 20% putative layer 4 neurons and 54.3% putative layer five neurons). *p<0.05, **p<0.01. In cases the SI for isolated vibrissa deflections were compared with paired vibrissa deflections and vM1 optogenetic activation using the paired student's t-test. (E) Percent of neurons that retained the same SI with and without vM1 optogenetic activation as a function of the control SI value (SI < 1.5, SI = 1.5–2 and SI > 2). (F) The average (mean ± SEM) ratio between the SI value recorded without (SIcont) and with (SIlaser) vM1 optogenetic activation in all recorded neurons and in neurons which retained the preferred angle with and without optogenetic activation (stable), and in neurons that changed their preferred angle after vM1 activation (unstable). **p<0.01. DOI: http://dx.doi.org/10.7554/eLife.21843.011
Figure 6—figure supplement 1.
Figure 6—figure supplement 1.. The effect of vM1 activation on angular tuning.
(A) The effect of optogenetic activation of vM1 on the SI of the preferred direction in 50–60 day old (left) and 90–100 day old mice (right). (B) The effect of optogenetic activation of vM1 on the SI of the preferred direction and of the worst three directions. **p<0.01, *p<0.05. DOI: http://dx.doi.org/10.7554/eLife.21843.012

Similar articles

Cited by

References

    1. Ahrens KF, Kleinfeld D. Current flow in Vibrissa motor cortex can phase-lock with exploratory rhythmic whisking in rat. Journal of Neurophysiology. 2004;92:1700–1707. doi: 10.1152/jn.00020.2004. - DOI - PubMed
    1. Andermann ML, Moore CI. A somatotopic map of vibrissa motion direction within a barrel column. Nature Neuroscience. 2006;9:543–551. doi: 10.1038/nn1671. - DOI - PubMed
    1. Aronoff R, Matyas F, Mateo C, Ciron C, Schneider B, Petersen CC. Long-range connectivity of mouse primary somatosensory barrel cortex. European Journal of Neuroscience. 2010;31:2221–2233. doi: 10.1111/j.1460-9568.2010.07264.x. - DOI - PubMed
    1. Bagdasarian K, Szwed M, Knutsen PM, Deutsch D, Derdikman D, Pietr M, Simony E, Ahissar E. Pre-neuronal morphological processing of object location by individual whiskers. Nature Neuroscience. 2013;16:622–631. doi: 10.1038/nn.3378. - DOI - PubMed
    1. Bosman LWJ, Houweling AR, Owens CB, Tanke N, Shevchouk OT, Rahmati N, Teunissen WHT, Ju C, Gong W, Koekkoek SKE, De Zeeuw CI. Anatomical pathways involved in generating and sensing rhythmic whisker movements. Frontiers in Integrative Neuroscience. 2011;5:53. doi: 10.3389/fnint.2011.00053. - DOI - PMC - PubMed

Publication types

LinkOut - more resources