. 2017 Jan 6:6:e21330.
doi: 10.7554/eLife.21330.

Glycolysis and glutaminolysis cooperatively control T cell function by limiting metabolite supply to N-glycosylation

Affiliations

Glycolysis and glutaminolysis cooperatively control T cell function by limiting metabolite supply to N-glycosylation

Lindsey Araujo et al. Elife. .

Abstract

Rapidly proliferating cells switch from oxidative phosphorylation to aerobic glycolysis plus glutaminolysis, markedly increasing glucose and glutamine catabolism. Although Otto Warburg first described aerobic glycolysis in cancer cells >90 years ago, the primary purpose of this metabolic switch remains controversial. The hexosamine biosynthetic pathway requires glucose and glutamine for de novo synthesis of UDP-GlcNAc, a sugar-nucleotide that inhibits receptor endocytosis and signaling by promoting N-acetylglucosamine branching of Asn (N)-linked glycans. Here, we report that aerobic glycolysis and glutaminolysis co-operatively reduce UDP-GlcNAc biosynthesis and N-glycan branching in mouse T cell blasts by starving the hexosamine pathway of glucose and glutamine. This drives growth and pro-inflammatory TH17 over anti-inflammatory-induced T regulatory (iTreg) differentiation, the latter by promoting endocytic loss of IL-2 receptor-α (CD25). Thus, a primary function of aerobic glycolysis and glutaminolysis is to co-operatively limit metabolite supply to N-glycan biosynthesis, an activity with widespread implications for autoimmunity and cancer.

Keywords: N-acetylglucosamine; N-glycosylation; T cell; Warburg effect; cell biology; glutaminolysis; glycolysis; immunology; mouse.


Conflict of interest statement

The authors declare that no competing interests exist.

Figures
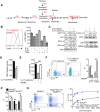
Figure 1.
Figure 1.. N-glycan branching controls TH17 versus iTreg cell fate.
(A) Fructose 6-phosphate and glutamine may be metabolized by glycolysis and glutaminolysis, respectively, or enter the hexosamine pathway to supply UDP-GlcNAc to the Golgi branching enzymes Mgat1, 2, 4 and 5. HK: hexokinase, GPI: glucose-6-phosphate isomerase, PFK1: phosphofructokinase1, LDH: Lactate dehydrogenase, GFPT: glutamine-fructose-6-phosphate transaminase. (BH) Flow cytometry (B,EH), Western blot (C) and LC-MS/MS (D) analysis of purified mouse splenic CD4+ T-cells activated with anti-CD3+anti-CD28 for 4 days (B,EH) or 3 days (C,D) with TH17 inducing conditions (TGFβ+IL-6+IL-23) or as indicated. PFK1-L (liver), PFK1-P (platelet), PFK1-M (muscle). (G) Co-incubation with doxycycline in vitro. (H) Doxycycline treatment in vivo, with Mgat1f/ftetO-Cre+ROSArtTA cells in right panel gated on L-PHA population. (B,EH) gated on CD4+. (B,DH) Unpaired two tailed t-test with Welch’s (E) and Bonferroni corrections (B,E). **p<0.01; ***p<0.001. Data are mean ± s.e.m of triplicate cultures and representative of n ≥ 3 experiments. MFI, mean fluorescence intensity. DOI: http://dx.doi.org/10.7554/eLife.21330.002
Figure 1—figure supplement 1.
Figure 1—figure supplement 1.. N-glycan branching controls TH17 versus iTreg cell fate.
(A–F) Flow cytometry (A,B,E,F), real-time qPCR (C) and UDP-GlcNAc LC-MS/MS analysis (D) of purified mouse splenic CD4+ T-cells activated with anti-CD3+anti-CD28 under TH17 inducing conditions (TGFβ+IL-6+IL-23) for 3 days (D) or 4 days (A,B,E,F) or as indicated (C). (A) gated on CD4+IL-17A- or CD4+IL-17A+ as indicated. (B,E,F), gated on CD4. (B) Lactose (50 mM) is an inhibitor of galectin binding to branched N-glycans. (A,B,F) Unpaired two tailed t-test (B) with Bonferroni corrections (A,F). *p<0.05; **p<0.01; ***p<0.001. Data are mean ± s.e.m and n = 3. MFI, mean fluorescence intensity. DOI: http://dx.doi.org/10.7554/eLife.21330.003
Figure 1—figure supplement 2.
Figure 1—figure supplement 2.. N-glycan branching controls TH17 versus iTreg cell fate.
(A–C) Flow cytometry of purified mouse splenic CD4+ T-cells activated with anti-CD3+anti-CD28 under TH17 inducing conditions (TGFβ+IL-6+IL-23) or as indicated for 4 days. Gated on CD4+. (C) Unpaired two tailed with Bonferroni corrections. *p<0.05; **p<0.01; ***p<0.001. Data are mean ± s.e.m and n = 3. MFI, mean fluorescence intensity. DOI: http://dx.doi.org/10.7554/eLife.21330.004
Figure 2.
Figure 2.. N-glycan branching controls TH17 versus iTreg cell fate via IL-2Rα (CD25).
(A–F) Flow cytometry (A–C,E,F) and Western blot (D) analysis of mouse splenic CD4+ T-cells activated with anti-CD3+anti-CD28 under TH17-inducing conditions (TGFβ+IL-6+IL-23) for 3 days (D) or 4 days (A–C,E,F); cells gated on CD4+. (A,F) Doxycycline treatment in vivo with Mgat1f/ftetO-Cre+ROSArtTA cells gated on L-PHA population. (C) CD25 MFI in Mgat5tetOROSArtTA CD4+ T cells normalized to ROSrtTA CD4+ T cells, both treated in vitro with doxycycline. (E,F) ratio of IL-17A+ to FoxP3+ CD4+ cells. (A,B,E,F) Unpaired two-tailed t-test with Welch’s (A,E) and Bonferroni corrections (E,F). (C) Linear regression. *p<0.05; **p<0.01; ***p<0.001. Data are mean ± s.e.m of triplicate cultures and representative of n ≥ 3 experiments. MFI, mean fluorescence intensity. DOI: http://dx.doi.org/10.7554/eLife.21330.005
Figure 2—figure supplement 1.
Figure 2—figure supplement 1.. N-glycan branching controls TH17 versus iTreg cell fate via IL-2Rα (CD25).
(A–D,F–H) Flow cytometry of purified mouse splenic CD4+ T-cells activated with anti-CD3+anti-CD28 under TH17 inducing conditions (TGFβ+IL-6+IL-23) or as indicated for 4 days. (D) Co-incubation with doxycycline in vitro. (A–C,D,F–H) gated on CD4+. (A,B) Mice treated with doxycycline in vivo, Mgat1f/ftetO-Cre+ROSArtTA gated on L-PHA- cells. (A) Gated on CD4+IL-17A- or CD4+IL-17A+ as indicated. (B) Endocytosis analyzed by flow cytometry for CD25 internalization. Internalized percentage (MFI (internalized) / MFI (total) × 100%), normalized to control. (D) ELISA analysis of supernatant from purified mouse splenic CD4+ T-cells activated with anti-CD3+anti-CD28 under TH17-inducing conditions (TGFβ+IL-6+IL-23) as indicated for 4 days. (A,B,E) Unpaired two-tailed t-test with Welch’s (A) and Bonferroni corrections (E). *p<0.05; **p<0.01; ***p<0.001. Data are mean ± s.e.m and n = 3, except n = 2 for (B). MFI, mean fluorescence intensity. DOI: http://dx.doi.org/10.7554/eLife.21330.006
Figure 3.
Figure 3.. Glycolysis promotes TH17 over iTreg cell fate by inhibiting N-glycan branching.
(A–C) Ratio of the oxygen consumption rate (OCR) to the extracellular acidification rate (ECAR) of purified splenic CD4+ T cells at rest or activated with anti-CD3+anti-CD28 for 2 days with TH17 cytokines (TGFβ+IL-6+IL-23) or as indicated. (D–G) Flow cytometry analysis of purified mouse splenic CD4+ T-cells activated with anti-CD3+anti-CD28 for 4 days under TH17-inducing conditions (TGFβ+IL-6+IL-23). (F (right panel), G) ratio of IL-17A+ to Foxp3+ CD4+ T cells, with Mgat1f/ftetO-Cre+ROSArtTA cells gated on L-PHA- population. *p<0.05; **p<0.01; ***p<0.001. NS, not significant. (A–G), Unpaired two-tailed t-test with Welch's (B,C,F,G) and Bonferroni correction (A–C,F,G). Data are mean ± s.e.m and n = 3. MFI, mean fluorescence intensity. DOI: http://dx.doi.org/10.7554/eLife.21330.007
Figure 3—figure supplement 1.
Figure 3—figure supplement 1.. Glycolysis promotes TH17 over iTreg cell fate by inhibiting N-glycan branching.
(A) Flow cytometry analysis of purified splenic CD4+ T cells activated with anti-CD3+ anti-CD28 for 2 days with TH17 cytokines and as indicated for 1 hr with 2-NBDG. (B) Oxygen Consumption Rate (OCR) and the Extracellular Acidification Rate (ECAR) of purified splenic CD4+ T cells at rest or activated with anti-CD3+anti-CD28 for 2 days with/without TH17 cytokines (TGFβ+IL-6+IL-23) as indicated. (C–G) Flow cytometry (C,D,F,G) and Western blot (E) analysis of purified mouse splenic CD4+ T-cells activated with anti-CD3+anti-CD28 under TH17-inducing conditions (TGFβ+IL-6+IL-23). Gated on CD4+ T cells. *p<0.05; **p<0.01; ***p<0.001. (A–D,F,G) Unpaired two-tailed t-test with Welch's (B–D) and Bonferroni correction (A–D). Data are mean ± s.e.m and n = 3. MFI, mean fluorescence intensity. DOI: http://dx.doi.org/10.7554/eLife.21330.008
Figure 4.
Figure 4.. Oxidative phosphorylation promotes iTreg generation by enhancing N-glycan branching.
(A–F) Flow cytometry of purified splenic CD4+ T cells activated with anti-CD3+anti-CD28 and TGFβ1 for 4 days; gated on CD4+. (A), Mgat1f/ftetO-Cre+ROSArtTA cells gated on L-PHA- population from mice treated with doxycycline in vivo. *p<0.05; **p<0.01; ***p<0.001. (A–F) Unpaired two-tailed t-test with Bonferroni (C–F) and Welch’s (C,E,F) correction. Data are mean ± s.e.m and n = 3. MFI, mean fluorescence intensity. DOI: http://dx.doi.org/10.7554/eLife.21330.009
Figure 4—figure supplement 1.
Figure 4—figure supplement 1.. Oxidative phosphorylation promotes iTreg generation by enhancing N-glycan branching.
(A,B) Flow cytometry of purified splenic CD4+ T cells activated with anti-CD3+anti-CD28 and TGFβ1 for 4 days; gated on CD4+. (A) Mgat1f/ftetO-Cre+ROSArtTA cells gated on L-PHA- population from mice treated with doxycycline in vivo. *p<0.05; **p<0.01; ***p<0.001. (B) Unpaired two-tailed t-test; data are mean ± s.e.m. n = 3. DOI: http://dx.doi.org/10.7554/eLife.21330.010
Figure 5.
Figure 5.. Glycolysis promotes T cell growth by inhibiting N-glycan branching.
(A–C) Flow cytometry of purified splenic CD4+ T cells activated with anti-CD3 for 3 days, gated on CD4+. (B,C) Proliferation measured by CFSE dilution. *p<0.05; **p<0.01; ***p<0.001. (A) Unpaired two-tailed t-test with Bonferroni correction. Data are mean ± s.e.m of triplicate cultures and representative of n = 3 experiments. MFI, mean fluorescence intensity. DOI: http://dx.doi.org/10.7554/eLife.21330.011
Figure 5—figure supplement 1.
Figure 5—figure supplement 1.. Glycolysis promotes T cell growth by inhibiting N-glycan branching.
Flow cytometry of CFSE-labeled splenic CD4+ T cells activated with anti-CD3 for 3 days, gated on CD4+. n = 3. DOI: http://dx.doi.org/10.7554/eLife.21330.012
Figure 6.
Figure 6.. Glutaminolysis promotes TH17 over iTreg cell fate by inhibiting N-glycan branching.
(A–J) Flow cytometry of purified splenic CD4+ T cells activated with anti-CD3+anti-CD28 under TH17-inducing conditions (TGFβ+IL-6+IL-23) (A,B,E–J) or in the presence of TGFβ (C,D). Gated on CD4+. *p<0.05; **p<0.01; ***p<0.001. (A–D,G–J) Unpaired one-tailed t-test with Welch's (G,I,J) and Bonferroni (B,D,G–J) correction. Data are mean ± s.e.m and n = 3. MFI, mean fluorescence intensity. DOI: http://dx.doi.org/10.7554/eLife.21330.013
Figure 6—figure supplement 1.
Figure 6—figure supplement 1.. Glutaminolysis promotes TH17 over iTreg cell fate by inhibiting N-glycan branching.
(A,B) Flow cytometry of purified splenic CD4+ T cells activated with anti-CD3+anti-CD28 under TH17-inducing conditions (TGFβ+IL-6+IL-23) (A) or in the presence of TGFβ (B). Gated on CD4+. n = 3. DOI: http://dx.doi.org/10.7554/eLife.21330.014

References

    1. Chang CH, Curtis JD, Maggi LB, Faubert B, Villarino AV, O'Sullivan D, Huang SC, van der Windt GJ, Blagih J, Qiu J, Weber JD, Pearce EJ, Jones RG, Pearce EL. Posttranscriptional control of T cell effector function by aerobic glycolysis. Cell. 2013;153:1239–1251. doi: 10.1016/j.cell.2013.05.016. - DOI - PMC - PubMed
    1. Chen IJ, Chen HL, Demetriou M. Lateral compartmentalization of T cell receptor versus CD45 by galectin-N-glycan binding and microfilaments coordinate basal and activation signaling. Journal of Biological Chemistry. 2007;282:35361–35372. doi: 10.1074/jbc.M706923200. - DOI - PubMed
    1. Chen HL, Li CF, Grigorian A, Tian W, Demetriou M. T cell receptor signaling co-regulates multiple golgi genes to enhance N-glycan branching. Journal of Biological Chemistry. 2009;284:32454–32461. doi: 10.1074/jbc.M109.023630. - DOI - PMC - PubMed
    1. Cummings RD, Kornfeld S. Characterization of the structural determinants required for the high affinity interaction of asparagine-linked oligosaccharides with immobilized phaseolus vulgaris leukoagglutinating and erythroagglutinating lectins. The Journal of Biological Chemistry. 1982;257:11230–11234. - PubMed
    1. Davidson TS, DiPaolo RJ, Andersson J, Shevach EM. Cutting edge: IL-2 is essential for TGF-beta-mediated induction of Foxp3+ T regulatory cells. The Journal of Immunology. 2007;178:4022–4026. doi: 10.4049/jimmunol.178.7.4022. - DOI - PubMed

Publication types