. 2017 Jan 27;355(6323):408-411.
doi: 10.1126/science.aaf4778. Epub 2017 Jan 5.

Control of meiotic pairing and recombination by chromosomally tethered 26S proteasome

Affiliations

Control of meiotic pairing and recombination by chromosomally tethered 26S proteasome

Jasvinder S Ahuja et al. Science. .

Abstract

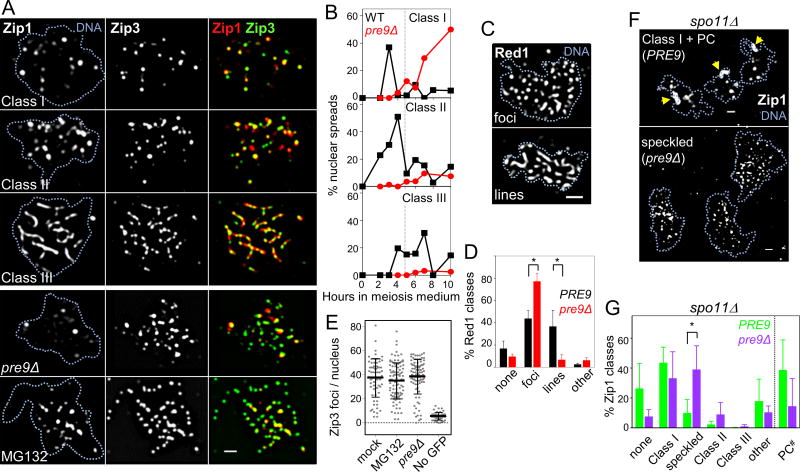
During meiosis, paired homologous chromosomes (homologs) become linked via the synaptonemal complex (SC) and crossovers. Crossovers mediate homolog segregation and arise from self-inflicted double-strand breaks (DSBs). Here, we identified a role for the proteasome, the multisubunit protease that degrades proteins in the nucleus and cytoplasm, in homolog juxtaposition and crossing over. Without proteasome function, homologs failed to pair and instead remained associated with nonhomologous chromosomes. Although dispensable for noncrossover formation, a functional proteasome was required for a coordinated transition that entails SC assembly between longitudinally organized chromosome axes and stable strand exchange of crossover-designated DSBs. Notably, proteolytic core and regulatory proteasome particles were recruited to chromosomes by Zip3, the ortholog of mammalian E3 ligase RNF212, and SC protein Zip1 . We conclude that proteasome functions along meiotic chromosomes are evolutionarily conserved.


Figures

Fig. 1
Fig. 1. The proteasome controls meiotic progression and homologue pairing
(A) Meiotic progression in WT, pre9Δ, zip1Δ at (i) 23°C and (ii) 33°C, in presence of MG132 (iii, pink arrow and (iv) in spo11Δ pre9Δ versus pre9Δ. n = 2; error bars indicate data range. (B) Localization of GFP-tagged centromere V (cenV, arrows) and total kinetochore signals (MTW1-13xMyc) in nuclei with homologous centromere pairing (WT, left) or homology-independent centromere coupling (pre9Δ, right). Blue lines (DNA) trace edges of spread nuclei stained with 4’,6’-diamidino-2-phenylindole (DAPI). Bar 1 µm. (C) Fraction of prophase I-arrested nuclei with one, two, or 0 or > 2 (“other”) GFP signals in strains homozygous for tetO arrays (i) near cenV, on the long arms of (ii) chromosome V, or (iii) chromosome II; or (iv) heterozygous for tetO at non-allelic arm loci on chromosomes II and V (25). n = 2; error bars indicate data range (also see fig. S1d). (D) Number of kinetochore signals in WT (14.1 ± 2.5 SD) and in pre9Δ (12.9 ± 3.8 SD). For nucleus numbers, see Table S1.
Fig. 2
Fig. 2. The proteasome controls DSB formation and the crossover-specific DSB-to-SEI transition (33°C)
(A) Cumulative DSB signals at five recombination hotspots at t = 7.5 h in a sae2Δ background. n = 3, error bars are SD (also see fig. S2). (B) 1D gel Southern analyses of DSBs and COs (i, ii), and NCOs (iii) in pre9Δ, zip1Δ, and WT. Time points are 0,2.5,4,5,6,7,8.5,10,11, and 24 h (asterisk in (iii): inverted loading order of 2.5 h and 4 h zip1Δ samples). (C) Quantitation of DSBs, COs and NCOs in pre9Δ, zip1Δ and WT. Dotted vertical line, t = 5 h (also see fig. S4). (D) 2D gel Southern analyses of JM intermediates in WT and pre9Δ. (E) Quantitative analysis of JMs in WT, pre9Δ and zip1Δ (also see fig. S5a,b).
Fig. 3
Fig. 3. The proteasome controls axis morphogenesis and synapsis (33°C)
(A) Zip1 and Zip3-GFP localization in WT Class I, II or III nuclear spreads; in pre9Δ; and in presence of MG132 (bottom). Blue dotted lines, see Fig. 1B. Bar 1 µm. (B) Zip1 localization in WT and pre9Δ cultures. For Zip1 classes, see Fig. 3A. (C) Red1-staining classes. Bar 1 µm. (D) Quantitation of Red1 classes at t = 6 h in PRE9 and pre9Δ in ndt80Δ background. “other” indicates poorly spread nuclei. n ≥ 3; error bars, SD; * p < 0.03, two-tailed t-test. (E) Zip3-GFP focus numbers in a pdr5Δ culture treated with DMSO (mock; 37.4 ± 16.1) or with MG132 (34.8 ± 15.0), in pre9Δ (38.3 ± 14.3) or in an untagged WT strain (5.3 ± 3.1) at time of WT pachytene (t = 6h). Errors are SD (also see fig. S7c). (F) Zip1 localization in PRE9 spo11Δ (n = 3) and pre9Δ spo11Δ (n = 3) nuclei. Arrows indicate polycomplexes. Bar 1 µm. (G) Quantitation of Zip1 localization in a spo11Δ background. # Polycomplexes (PC) were scored independent of patterns of chromatin-associated Zip1. Fractions are averages from two cultures at t = 3.5 h and 5 h or t = 4 h and 6 h, respectively; error bars, SD; * p < 0.03, two-tailed t-test. For nucleus numbers, see Table S1.
Fig. 4
Fig. 4. Meiosis-specific recruitment of the 26S proteasome to chromosomes is evolutionarily conserved
(A) Localization of the proteasome CP (α5Pup2) and Zip1 on WT G0/1-arrested (t = 0h), leptotene (t = 2h), early pachytene (t = 5h) and late pachytene/ diplotene (t = 6h) nuclear spreads. Bar 1 µm. (B) Same as (A), but for proteasome RP component Rpn12-GFP without 2 h sample. (C) CP (α5Pup2-GFP) and Zip1 localization in spo11-yf (t = 5h), zip3Δ (t = 6h) and zip1Δ (t = 6h). Arrows, CP foci associated with PCs. Bar 1 µm. (D) CP focus counts in WT, spo11-yf, zip3Δ and zip1Δ. Pachytene (Zip1 Class III; red), meiotic divisions (blue). §, for focus scoring see 30; fig. S11). Asterisks indicate significant differences versus corresponding WT sample (two-tailed Wilcoxon rank sum test): **, p < 0.01; *, p < 0.05; n.s., p > 0.05. (E) RP focus counts in WT (also see Fig. 4D). (F) Requirement for C. elegans α3PAS-3 CP for SC axis and central element assembly. Region 1 (transition zone) excerpts from (i) WT and (ii) pas-3(RNAi) knockdown animals stained with HTP-3 and SYP-1. Arrows indicate HTP-3/SYP-1 coaggregates (also see fig. S12). Bar 4 µm. (G) Squashed pachytene nucleus stained with anti-CP20S and anti-SYP-1 antibodies. Overlap is similar in ≥ 99% of nuclei (n > 100) from 20 germ lines (also see fig. S13b). Bar 2 µm. (H) Proteasome and SYCP3 localization along surface-spread mouse spermatocytes at the leptotene (n=5), zygotene (n = 34), pachytene (n = 115), or diplotene stages (n = 47). Bar 5 µm. Insets show magnified views of boxed areas (also see fig. S13c,d). (I) Model for proteasome functions in homologue pairing, synapsis (SC) and crossover (CO) formation (see text for details).

Comment in

  • When degradation spurs segregation.
    Zetka M. Zetka M. Science. 2017 Jan 27;355(6323):349-350. doi: 10.1126/science.aam5904. Science. 2017. PMID: 28126771 No abstract available.
  • Proteasomes on the chromosome.
    Lichten M. Lichten M. Cell Res. 2017 May;27(5):602-603. doi: 10.1038/cr.2017.28. Epub 2017 Mar 7. Cell Res. 2017. PMID: 28266542 Free PMC article.

References

    1. Zickler D, Kleckner N. Recombination, Pairing, and Synapsis of Homologs during Meiosis. Cold Spring Harb. Perspect. Biol. 2015;18:7. pii: a016626. - PMC - PubMed
    1. Tsubouchi T, Roeder GS. A synaptonemal complex protein promotes homology-independent centromere coupling. Science. 2005;308:870–873. - PubMed
    1. Obeso D, Pezza RJ, Dawson D. Couples, pairs, and clusters: mechanisms and implications of centromere associations in meiosis. Chromosoma. 2014;123:43–55. - PMC - PubMed
    1. Obeso D, Dawson DS. Temporal characterization of homology-independent centromere coupling in meiotic prophase. PLoS One. 2010;5:e10336. - PMC - PubMed
    1. Börner GV, Kleckner N, Hunter N. Crossover/ noncrossover differentiation, synaptonemal complex formation, and regulatory surveillance at the leptotene/zygotene transition of meiosis. Cell. 2004;117:29–45. - PubMed

Publication types

MeSH terms

Substances

LinkOut - more resources