. 2017 Jan 6;355(6320):78-83.
doi: 10.1126/science.aah4199.

Rb1 and Trp53 cooperate to suppress prostate cancer lineage plasticity, metastasis, and antiandrogen resistance

Affiliations

Rb1 and Trp53 cooperate to suppress prostate cancer lineage plasticity, metastasis, and antiandrogen resistance

Sheng Yu Ku et al. Science. .

Abstract

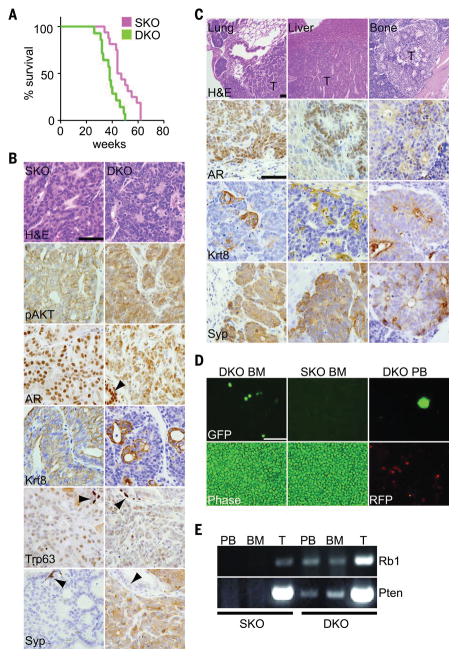
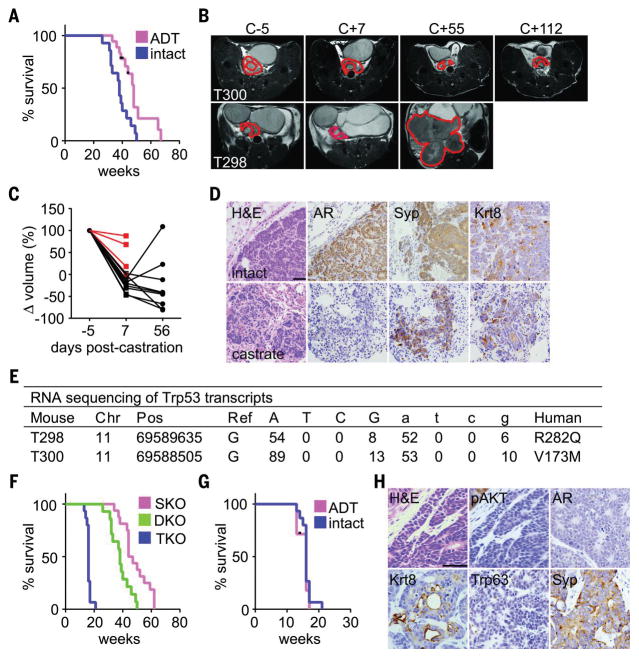
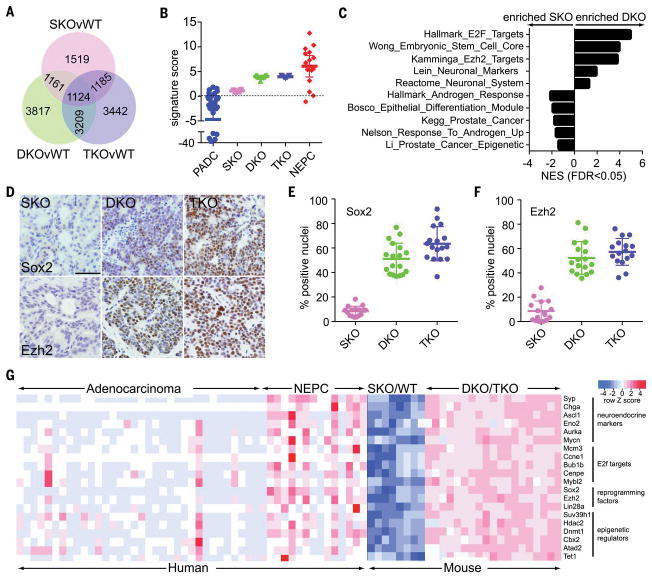
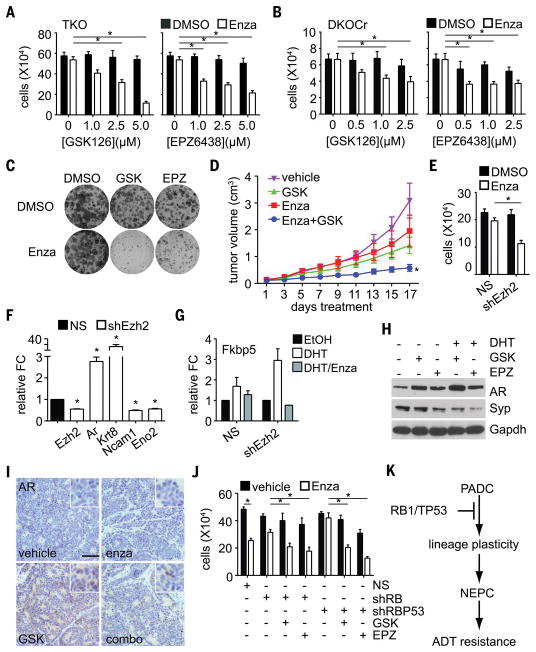
Prostate cancer relapsing from antiandrogen therapies can exhibit variant histology with altered lineage marker expression, suggesting that lineage plasticity facilitates therapeutic resistance. The mechanisms underlying prostate cancer lineage plasticity are incompletely understood. Studying mouse models, we demonstrate that Rb1 loss facilitates lineage plasticity and metastasis of prostate adenocarcinoma initiated by Pten mutation. Additional loss of Trp53 causes resistance to antiandrogen therapy. Gene expression profiling indicates that mouse tumors resemble human prostate cancer neuroendocrine variants; both mouse and human tumors exhibit increased expression of epigenetic reprogramming factors such as Ezh2 and Sox2. Clinically relevant Ezh2 inhibitors restore androgen receptor expression and sensitivity to antiandrogen therapy. These findings uncover genetic mutations that enable prostate cancer progression; identify mouse models for studying prostate cancer lineage plasticity; and suggest an epigenetic approach for extending clinical responses to antiandrogen therapy.


Figures

Fig. 1
Fig. 1. Rb1 suppresses PADC metastasis in mice
(A) Survival plot showing a significant difference in survival of SKO (n = 16) and DKO (n = 14) mice (log rank P = 0.0013). (B) End-stage tumor sections stained with hematoxylin and eosin (H&E) or antibodies against the indicated proteins. Arrowheads indicate uninvolved prostate epithelium. Scale bars, 100 μm. (C) Sections of DKO metastases from indicated tissues stained and presented as in (B). (D) Bone marrow (BM) or peripheral blood (PB) from SKO and DKO mice was imaged under phase or fluorescent microscopy. Cancer cells were genetically marked with green fluorescent protein (GFP), and normal cells were marked with red fluorescent protein (RFP). Scale bar, 100 μm. (E) Polymerase chain reaction (PCR) was used to detect Cre-deleted alleles in PB, BM, or tumor DNA (T).
Fig. 2
Fig. 2. Rb1 and Trp53 loss facilitate acquisition of ADT resistance
(A) Survival plot for DKO mice, either intact (n = 14) or castrated at 30 weeks (n = 18, log rank P = 0.003). Black tic marks represent mice alive at the end of the study. (B) Axial T2-weighted MR images from two mice acquired at indicated times relative to castration. The prostate and resulting tumors are outlined in red. T300 initial prostate volume (68 mm3) was larger than T298 (21 mm3), but T300 survived longer after castration (37 weeks) than did T298 (12 weeks). (C) Prostate volumes of DKO mice were measured with magnetic resonance imaging (MRI) 5 days before castration at 30 weeks of age, or 1 and 8 weeks after castration. The plot shows relative prostate volumes for individual mice over time normalized to their precastration measurement. Red lines indicate mice that died before the 8-week MRI time point. (D) Tumor sections from intact or postcastration recurrent DKO tumors stained with H&E or antibodies directed against the indicated proteins. AR levels decline in postcastration recurrent tumors. Scale bar, 100 μm. (E) RNA-seq data from postcastration recurrent DKO tumors indicate that 88% of reads mapping to Trp53 have mutations analogous to loss-of-function mutations commonly found in human cancer. Single-letter abbreviations for the amino acid residues are as follows: A, Ala; C, Cys; D, Asp; E, Glu; F, Phe; G, Gly; H, His; I, Ile; K, Lys; L, Leu; M, Met; N, Asn; P, Pro; Q, Gln; R, Arg; S, Ser; T, Thr; V, Val; W, Trp; and Y, Tyr. In the mutants, other amino acids were substituted at certain locations; for example, R282Q indicates that arginine at position 282 was replaced by glutamine. (F) Survival plot showing significantly different survival of SKO (n = 16), DKO (n = 14), and TKO (n = 15) mice (log rank P < 0.0001). (G) Survival plot of TKO mice, either intact (n = 15) or castrated at 10 weeks (n = 7). Castration does not affect survival significantly (log rank P = 0.46). Black tic marks represent mice alive at the end of the study. (H) Tumor sections from TKO mice were stained with H&E or antibodies against the indicated proteins. Scale bar, 100 μm.
Fig. 3
Fig. 3. Rb1 loss causes deregulation of epigenetic reprogramming factors and widespread changes in gene expression
(A) Venn diagrams showing the number of differentially expressed genes between the indicated genotypes (wild type, WT; n = 4 or 5 mice per genotype). (B) Plot showing the signature scores for mouse (SKO, DKO, and TKO) and human (PADC and NEPC) prostate cancer by using the Beltran et al. (23) weighted gene expression signature. Dots represent individual patients. Bars represent the mean and interquartile range. (C) Selected gene sets enriched in DKO versus SKO tumors, with the x axis representing normalized enrichment score (NES). (D) Tumor sections stained with antibodies directed against indicated proteins. Scale bar, 100 μm. (E) Quantitation of Sox2 immunostaining in tumor sections of the indicated genotypes. Each dot represents one analyzed image taken from three different mice for each genotype, with bars representing the mean and standard deviation. Sox2 immunostaining in DKO tumors is greater than in SKO tumors (t test P < 0.0001) and greater in TKO tumors than in DKO tumors (P = 0.01). (F) Quantitation of Ezh2 immunostaining as in (E). Ezh2 immunostaining is greater in DKO tumors than in SKO tumors (P < 0.0001), but immunostaining in DKO and TKO tumors is not significantly different (P = 0.25). (G) A heat map comparing gene expression data from human (5, 23) and the indicated mouse specimens. The select genes deregulated in DKO and TKO tumors are similarly deregulated in human NEPC.
Fig. 4
Fig. 4. Ezh2 inhibition restores enzalutamide sensitivity
(A) A TKO cell line was treated with enzalutamide or dimethyl sulfoxide (DMSO), with or without Ezh2i, at the indicated concentrations, and the viable cells were then counted. Mean cell number and standard error are shown for three experiments. Asterisks indicate significant differences (P < 0.05). (B) A DKOCr cell line was treated and analyzed as in (A). (C) A DKOCr cell line was plated at low density, then treated as indicated. Resulting colonies were stained 10 days later. A representative result is shown (quantitation is provided in fig. S8A). (D) A DKOCr tumor was transplanted into a cohort of mice, and the mice were treated with GSK503 (GSK) and/or enzalutamide (Enza) as indicated. Tumor volume for each mouse (n = 7 or 8 for each treatment) was recorded every other day. The mean and standard error for all mice are shown. Asterisk indicates significantly slower growth than any of the other treatments (ANOVA, P < 0.05). (E) Ezh2-targeted shRNA (shEzh2), or nonsilencing control (NS), were expressed in DKOCr cells. The cells were then treated with enzalutamide or DMSO, and cell number was measured as in (A). The mean and standard error for three experiments are shown. (F) RNA was extracted from DKOCr cells in (E) and analyzed by means of real-time PCR for the indicated genes. The mean and standard error of fold change (FC) relative to the NS control are shown for two experiments in duplicate. (G) DKOCr cells silenced for Ezh2 as in (C) were treated with AR ligand R1881 (DHT) and/or enzalutamide (Enza), RNA was extracted, and the expression of AR target gene Fkbp5 was assayed by means of real-time PCR. Mean and standard error of FC relative to the NS control are shown for two experiments in duplicate. (H) DKO cells were treated as indicated, and protein extracts were analyzed by means of Western blot for the listed proteins. Gapdh serves as loading control. (I) Tumors dissected from transplanted mice in (D) after 17 days of the indicated treatment were sectioned and immunostained for AR. Inset image is magnified so as to highlight nuclear staining. Scale bar, 100 μm. Ezh2i treatment restores patchy AR expression. (J) LNCaP-AR cells stably expressing RB1 (shRB) or RB1/TP53 shRNA (shRBP53) were treated as indicated, and viable cells were counted as in (A). The mean and standard error of three experiments are shown. (K) A model summarizing the proposed role of Rb1 and Trp53 in suppressing lineage plasticity, neuroendocrine lineage transformation, and ADT resistance.

Comment in

References

    1. Sequist LV, et al. Sci Transl Med. 2011;3:75ra26. - PMC - PubMed
    1. Niederst MJ, et al. Nat Commun. 2015;6:6377. - PMC - PubMed
    1. Beltran H, et al. Clin Cancer Res. 2014;20:2846–2850. - PMC - PubMed
    1. Pezaro CJ, et al. Eur Urol. 2014;65:270–273. - PMC - PubMed
    1. Beltran H, et al. Nat Med. 2016;22:298–305. - PMC - PubMed

Publication types

MeSH terms