. 2017 Jan 6;355(6320):84-88.
doi: 10.1126/science.aah4307.

SOX2 promotes lineage plasticity and antiandrogen resistance in TP53- and RB1-deficient prostate cancer

Affiliations

SOX2 promotes lineage plasticity and antiandrogen resistance in TP53- and RB1-deficient prostate cancer

Ping Mu et al. Science. .

Abstract

Some cancers evade targeted therapies through a mechanism known as lineage plasticity, whereby tumor cells acquire phenotypic characteristics of a cell lineage whose survival no longer depends on the drug target. We use in vitro and in vivo human prostate cancer models to show that these tumors can develop resistance to the antiandrogen drug enzalutamide by a phenotypic shift from androgen receptor (AR)-dependent luminal epithelial cells to AR-independent basal-like cells. This lineage plasticity is enabled by the loss of TP53 and RB1 function, is mediated by increased expression of the reprogramming transcription factor SOX2, and can be reversed by restoring TP53 and RB1 function or by inhibiting SOX2 expression. Thus, mutations in tumor suppressor genes can create a state of increased cellular plasticity that, when challenged with antiandrogen therapy, promotes resistance through lineage switching.


Figures

Fig. 1
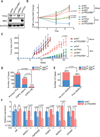
Fig. 1. Combined TP53 and RB1 loss of function confers enzalutamide resistance
(A) Western blot showing TP53 and RB1 protein levels in LNCaP/AR cells transduced with annotated hairpins. Glyceraldehyde-3-phosphate dehydrogenase (GAPDH) served as a loading control. (B) Growth curve of LNCaP/AR cells transduced with annotated hairpins in charcoal-stripped serum (CSS) medium, following LNCaP/AR protocol B (see materials and methods). Enz denotes 10-µg/ml enzalutamide treatment. Mock denotes the equivalent volume of dimethyl sulfoxide (DMSO) treatment. (C) Tumor growth curve of xenografted LNCaP/AR cells transduced with annotated hairpins. +Enz denotes enzalutamide treatment at 10 mg/kg orally 1 day after grafting. +Mock denotes DMSO treatment at the same dosage. (D) Number of cases of co-occurrence of TP53 and RB1 alterations in primary prostate cancer (PCa), CRPC with adenocarcinoma histology (CRPC-Adeno), and CRPC with neuroendocrine-like histology (CRPC-NE) (n = 559). The genomic status of the two genes was assessed from whole-exome sequencing data, as in (12). P values were calculated using Fisher’s exact test. The percentage of cases with alterations in both TP53 and RB1 in primary PCa, CRPC-Adeno, and CRPC-NE is shown. (E) Number of cases with TP53Alt, RB1Alt, based on whether the patient had already received therapy with enzalutamide or abiraterone (Abi/Enz) (n = 44 cases: 14 cases in the TP53WT, RB1WT group and 30 cases in the TP53Alt, RB1Alt group). P values were calculated using Fisher’s exact test. (F) Relative gene expression of AR and AR target genes in tumors collected from the LNCaP/AR xenograft model. Enz denotes enzalutamide treatment at 10 mg/kg from day 1 of grafting. Minus signs denote DMSO treatment at the same dosage. For all panels unless otherwise noted, mean ± SEM (error bars) is represented, and P values were calculated using multiple t tests. NS, not significant.
Fig. 2
Fig. 2. Combined TP53 and RB1 loss of function leads to increased lineage plasticity
(A) Western blot of selected cellular lineage markers in LNCaP/AR cells transduced with annotated hairpins in a stable vector system. GAPDH served as a loading control. (B) Relative gene expression of lineage markers in LNCaP/AR cells transduced with annotated hairpins in a stable vector system. (C) Expression of luminal- and basal-signature genes [as defined in table S1 and (30)] was compared in LNCaP/AR cells transduced with annotated hairpins (shTP53/RB1 versus shNT) by gene set enrichment analysis. (D) Western blot showing protein levels of selected lineage markers in LNCaP/AR cells transduced with hairpins against TP53 and RB1 in an inducible vector system at various time points. GAPDH served as a loading control. (E) Relative gene expression of lineage markers in LNCaP/AR cells transduced with hairpins against TP53 and RB1 in an inducible vector system at various time points. (F) Cell number of LNCaP/AR cells transduced with annotated hairpins in an inducible vector system, normalized to the −Enz group. Cells were treated with doxycycline for 48 hours and then treated with 7 days of enzalutamide in CSS medium, following LNCaP/AR protocol A. +Enz denotes 10-µg/ml enzalutamide treatment; −Enz denotes DMSO treatment with same volume as enzalutamide. For all panels unless otherwise noted, mean ± SEM (error bars) is represented, and P values were calculated using multiple t tests. NS, not significant. Cell types that express each set of lineage markers are indicated with different colors.
Fig. 3
Fig. 3. Elevation of SOX2 gene expression is highly correlated with the inactivation of TP53 and RB1
(A) Area under the curve (AUC)–based analysis indicating transcription factors (TFs) overexpressed in the TP53- and RB1-altered phenotype in both the CRPC patients from IPM-Cornell (12) and the SU2C–Prostate Cancer Foundation (PCF) 2015 cohorts (6) (AUC ≥ 0.65). (B) (Left) Fold change (FC) of transcript levels of the identified TFs in TP53- and RB1-altered versus TP53 and RB1 WT samples. Median values are shown. (Right) FC of identified TFs versus normalized expression in TP53 and RB1 WT samples, expressed as log2(FPKM+1). FPKM, fragments per kilobase of transcript per million mapped reads. The y axis serves both the left and right panels. (C) Relative expression of SOX2 in TP53- and RB1-altered and TP53 and RB1 WT samples for the IPM-Cornell (n = 35) (12) and SU2C-PCF 2015 (n = 77) data sets (6). For each cohort, data are scaled to the median of the TP53 and RB1 WT status. P value is Wilcoxon-Mann-Whitney, with lower and upper whiskers corresponding to the minimum and maximum nonoutlier values of the data distribution, respectively. (D) Relative gene expression of TP53, RB1, and SOX2 in LNCaP/AR cells transduced with annotated hairpins in a stable vector system. (E) Relative gene expression of TP53, RB1, and SOX2 in CWR22Pc-EP cells transduced with annotated hairpins in a stable vector system. (F) Relative gene expression of Trp53, Rb1, and Sox2 in Trp53loxP/loxP, Rb1loxP/loxP mouse organoids transduced with annotated Cre or empty vector. (G) Relative gene expression of TP53, RB1, and SOX2 in LNCaP/AR cells transduced with annotated hairpins in an inducible vector system at various time points. For all panels unless otherwise noted, mean ± SEM (error bars) is represented, and P values were calculated using multiple t tests.
Fig. 4
Fig. 4. SOX2 is required for lineage plasticity and enzalutamide resistance induced by inactivation of TP53 and RB1
(A) Relative gene expression of SOX2 and lineage marker genes in LNCaP/AR cells transduced with annotated hairpins in a stable vector system. (B) Cell numbers of LNCaP/AR transduced with annotated hairpins (shTP53 and RB1 versus shTP53 and RB1+shSOX2), normalized to the parental −Enz group. Cells were treated for 7 days with enzalutamide or DMSO in CSS medium, following LNCaP/AR protocol A. (C) Tumor growth curve of xenografted LNCaP/AR cells transduced with annotated hairpins. +Enz denotes enzalutamide treatment at 10 mg/kg orally 1 day after grafting. For panels (A) to (C) unless otherwise noted, mean ± SEM (error bars) is represented and P values were calculated using multiple t tests. (D) Model depicting the lineage plasticity change and antiandrogen resistance in CRPC-Adeno due to TP53 and RB1 alterations (TP53Alt, RB1Alt) compared to CRPC-Adeno with WT TP53 and RB1 (TP53WT, RB1WT).

Comment in

References

    1. Pao W, et al. PLOS Med. 2005;2:e73. - PMC - PubMed
    1. Gorre ME, et al. Science. 2001;293:876–880. - PubMed
    1. Lito P, Rosen N, Solit DB. Nat. Med. 2013;19:1401–1409. - PubMed
    1. Sequist LV, et al. Sci. Transl. Med. 2011;3:75ra26. - PMC - PubMed
    1. Beltran H, et al. Cancer Discov. 2011;1:487–495. - PMC - PubMed

Publication types

MeSH terms