Comparative Study
. 2017;56(2):743-761.
doi: 10.3233/JAD-161027.

Quantitative Comparison of Dense-Core Amyloid Plaque Accumulation in Amyloid-β Protein Precursor Transgenic Mice

Affiliations
Comparative Study

Quantitative Comparison of Dense-Core Amyloid Plaque Accumulation in Amyloid-β Protein Precursor Transgenic Mice

Peng Liu et al. J Alzheimers Dis. 2017.

Abstract

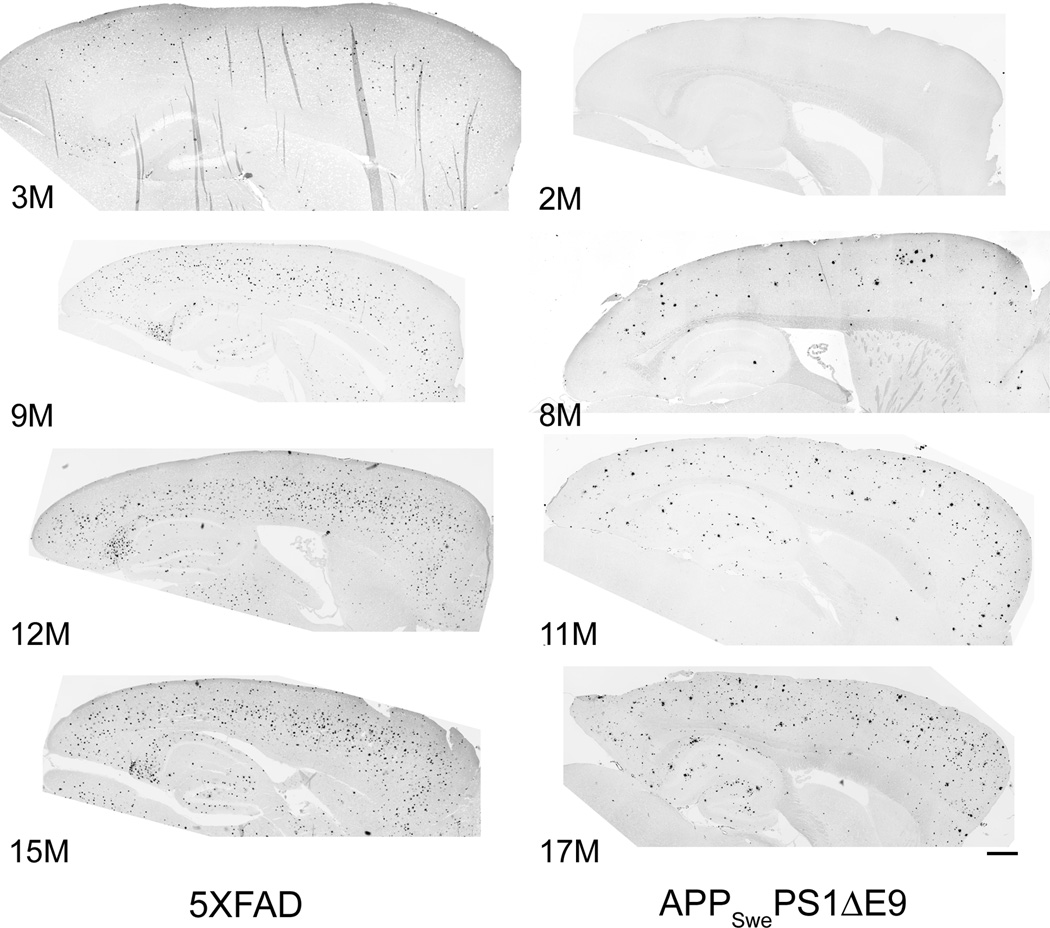
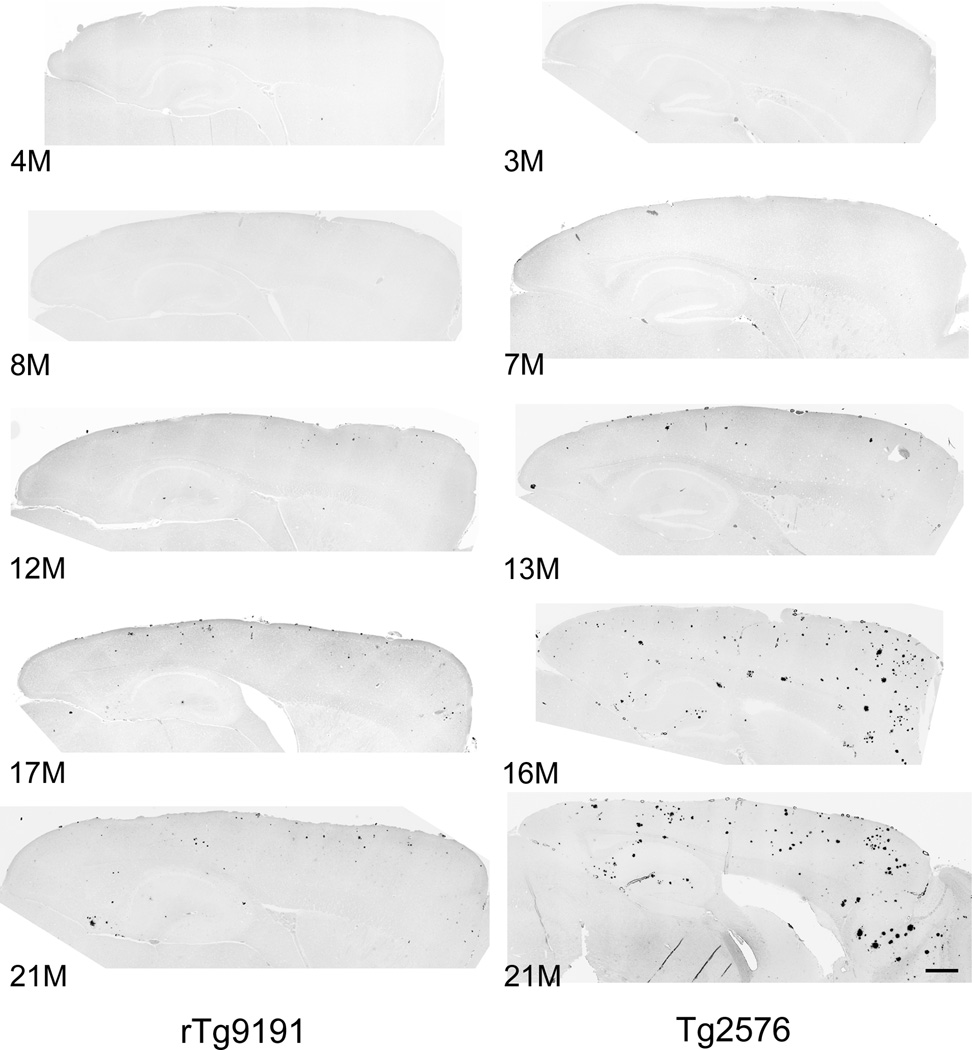
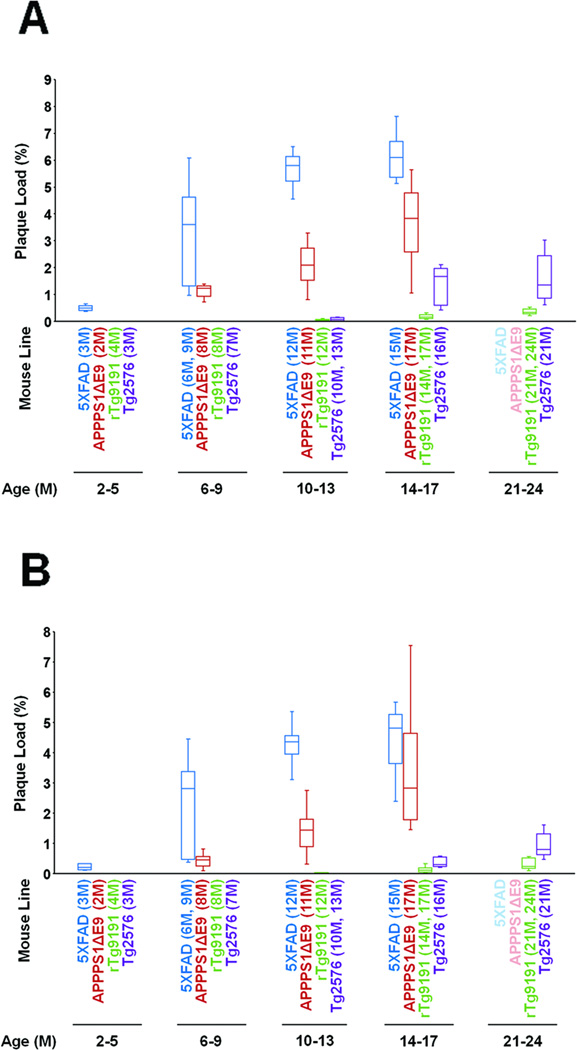
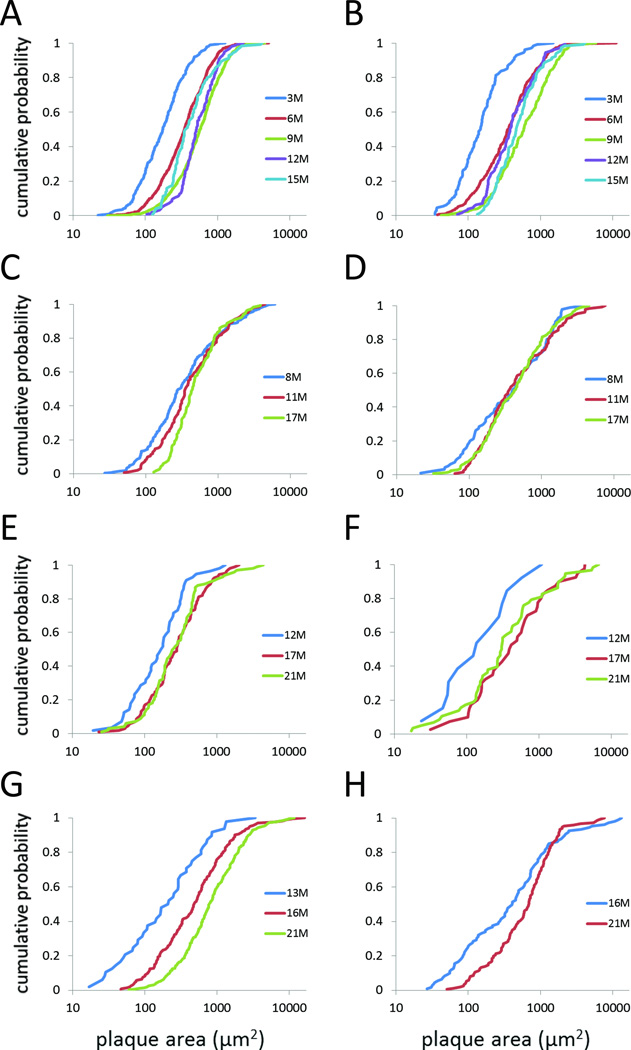
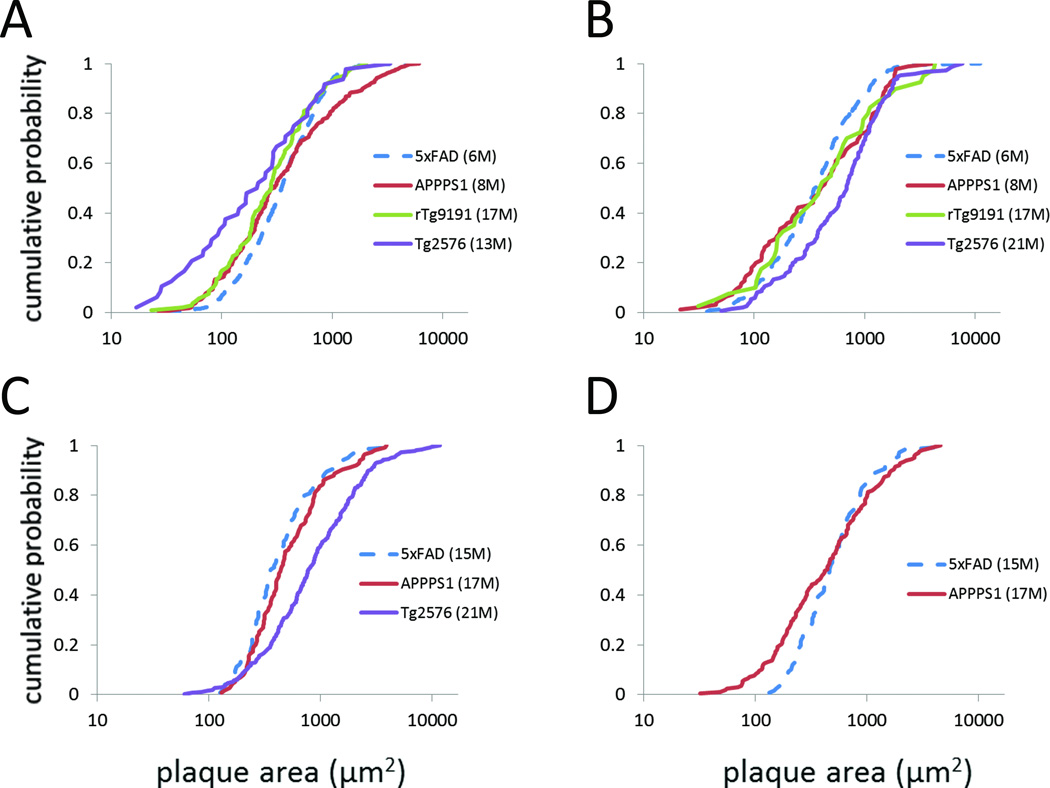
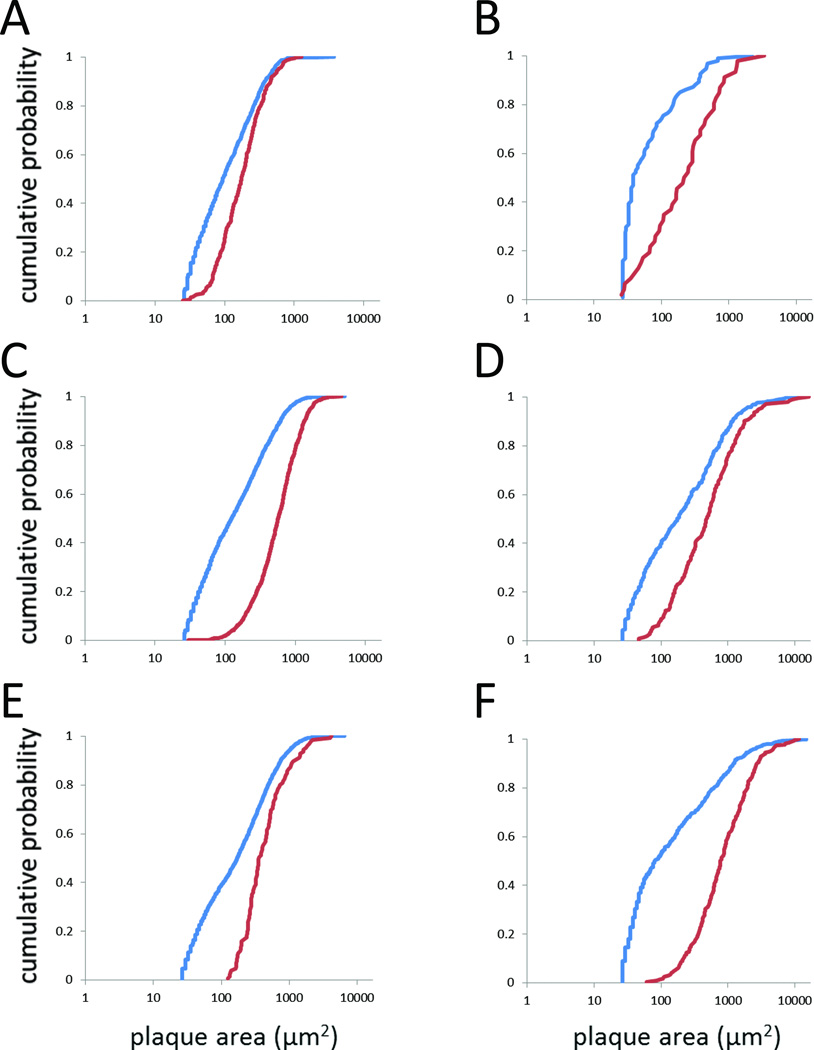
There exist several dozen lines of transgenic mice that express human amyloid-β protein precursor (AβPP) with Alzheimer's disease (AD)-linked mutations. AβPP transgenic mouse lines differ in the types and amounts of Aβ that they generate and in their spatiotemporal patterns of expression of Aβ assemblies, providing a toolkit to study Aβ amyloidosis and the influence of Aβ aggregation on brain function. More complete quantitative descriptions of the types of Aβ assemblies present in transgenic mice and in humans during disease progression should add to our understanding of how Aβ toxicity in mice relates to the pathogenesis of AD. Here, we provide a direct quantitative comparison of amyloid plaque burdens and plaque sizes in four lines of AβPP transgenic mice. We measured the fraction of cortex and hippocampus occupied by dense-core plaques, visualized by staining with Thioflavin S, in mice from young adulthood through advanced age. We found that the plaque burdens among the transgenic lines varied by an order of magnitude: at 15 months of age, the oldest age studied, the median cortical plaque burden in 5XFAD mice was already ∼4.5 times that of 21-month-old Tg2576 mice and ∼15 times that of 21-24-month-old rTg9191 mice. Plaque-size distributions changed across the lifespan in a line- and region-dependent manner. We also compared the dense-core plaque burdens in the mice to those measured in a set of pathologically-confirmed AD cases from the Nun Study. Cortical plaque burdens in Tg2576, APPSwePS1ΔE9, and 5XFAD mice eventually far exceeded those measured in the human cohort.

Keywords: Alzheimer’s disease; Thioflavin S; amyloid plaque; amyloid-β protein precursor; plaque burden; plaque size; transgenic mouse.


Figures

Fig. 1
Fig. 1. Age-dependent plaque deposition in female 5XFAD and male APPSwePS1ΔE9 mice
Photomicrographs of sagittal sections stained with Thioflavin S, to label dense-core plaques. Images were collected on a Nikon TiE deconvolution microscope with a 10× objective, then tiled to show complete sections. Images are shown with contrast inverted. Numbers indicate ages of mice (in months); dorsal is up, anterior is to the right. Scale bar, 500 µm.
Fig. 2
Fig. 2. Age-dependent plaque deposition in male rTg9191 and Tg2576 mice
Photomicrographs of sagittal sections stained with Thioflavin S, to label dense-core plaques. Images were collected on a Nikon TiE deconvolution microscope with a 10× objective, then tiled to show complete sections. Images are shown with contrast inverted. Numbers indicate ages of mice (in months); dorsal is up, anterior is to the right. Scale bar, 500 µm.
Fig. 3
Fig. 3. Quantification of dense-core (Thioflavin S-reactive) plaque burdens
The Thioflavin S plaque burden was calculated as the sum of the area of all Thioflavin S-reactive plaques divided by the total sampled area of cerebral cortex or hippocampal formation. (A) Cortex. (B) Hippocampus. Box plots show median, interquartile ranges, and minima and maxima for each line at each age evaluated. Note that APPSwePS1ΔE9 are labeled “APPPS1ΔE9” and that no data were available from 5XFAD or APPSwePS1ΔE9 at 21-24 months of age.
Fig. 4
Fig. 4. Plaque-size distributions as a function of age, within lines
Plaque-size distributions are represented as cumulative probability plots. (A, B) 5XFAD. (C, D) APPSwePS1ΔE9. (E, F) rTg9191. (G, H) Tg2576. Left column (A, C, E, G), cortex; right column (B, D, F, H), hippocampus. Data are from female 5XFAD mice, male APPSwePS1ΔE9, rTg9191, and Tg2576 mice.
Fig. 5
Fig. 5. Inter-line comparison of plaque-size distributions, based on duration of plaque deposition
Thioflavin-S plaque-area distributions, represented as cumulative probability plots, after 4±1 (A, B) or 12±1 (C, D) months of plaque deposition. (A, C) cortex; (B, D) hippocampus. Dashed lines indicate that data are from female 5XFAD mice; only male mice contributed data for the other lines. Note that APPSwePS1ΔE9 are labeled “APPPS1.”
Fig. 6
Fig. 6. Comparison of methods for measuring plaque sizes
Plaque size distributions obtained by viewing sections at higher magnification and measuring cortical plaque areas with Stereo Investigator (red) or by automated measurements on low-magnification images using ImageJ (blue). Only objects > 35 µm2 were included in this analysis. Six examples are shown, including sections with relatively high plaque burdens (5XFAD) and low-to-moderate plaque burdens (Tg2576). (A) 3M 5XFAD. (B) 13M Tg2576. (C) 9M 5XFAD. (D) 16M Tg2576. (E) 15M 5XFAD. (F) 21M Tg2576. In all cases, the distributions obtained by the two methods differed significantly (Kolmogorov-Smirnov test: p = 0.009 for 13M Tg2576, p < 0.006 for all other pairwise comparison, corrected for multiple comparisons).

References

    1. Alzforum, Research models. [Accessed March 31, 2015]; http://www.alzforum.org/research-models.
    1. Allue JA, Sarasa L, Izco M, Perez-Grijalba V, Fandos N, Pascual-Lucas M, Ogueta S, Pesini P, Sarasa M. Outstanding Phenotypic Differences in the Profile of Amyloid-beta between Tg2576 and APPswe/PS1dE9 Transgenic Mouse Models of Alzheimer's Disease. J Alzheimers Dis. 2016;53:773–785. - PMC - PubMed
    1. Kulnane LS, Lamb BT. Neuropathological characterization of mutant amyloid precursor protein yeast artificial chromosome transgenic mice. Neurobiol Dis. 2001;8:982–992. - PubMed
    1. Liu P, Reed MN, Kotilinek LA, Grant MK, Forster CL, Qiang W, Shapiro SL, Reichl JH, Chiang AC, Jankowsky JL, Wilmot CM, Cleary JP, Zahs KR, Ashe KH. Quaternary Structure Defines a Large Class of Amyloid-beta Oligomers Neutralized by Sequestration. Cell Rep. 2015;11:1760–1771. - PMC - PubMed
    1. Guerreiro R, Wojtas A, Bras J, Carrasquillo M, Rogaeva E, Majounie E, Cruchaga C, Sassi C, Kauwe JS, Younkin S, Hazrati L, Collinge J, Pocock J, Lashley T, Williams J, Lambert JC, Amouyel P, Goate A, Rademakers R, Morgan K, Powell J, St George-Hyslop P, Singleton A, Hardy J Alzheimer Genetic Analysis G. TREM2 variants in Alzheimer's disease. N Engl J Med. 2013;368:117–127. - PMC - PubMed

Publication types

MeSH terms

LinkOut - more resources