. 2017 Apr;24(4):649-659.
doi: 10.1038/cdd.2016.151. Epub 2017 Jan 6.

KCTD2, an adaptor of Cullin3 E3 ubiquitin ligase, suppresses gliomagenesis by destabilizing c-Myc

Affiliations

KCTD2, an adaptor of Cullin3 E3 ubiquitin ligase, suppresses gliomagenesis by destabilizing c-Myc

Eun-Jung Kim et al. Cell Death Differ. 2017 Apr.

Abstract

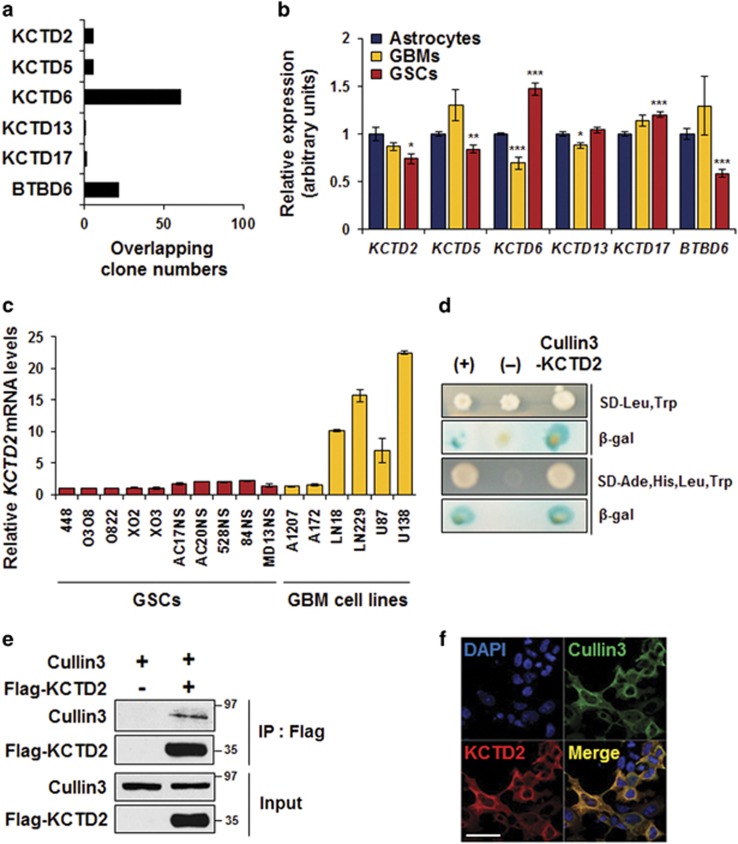
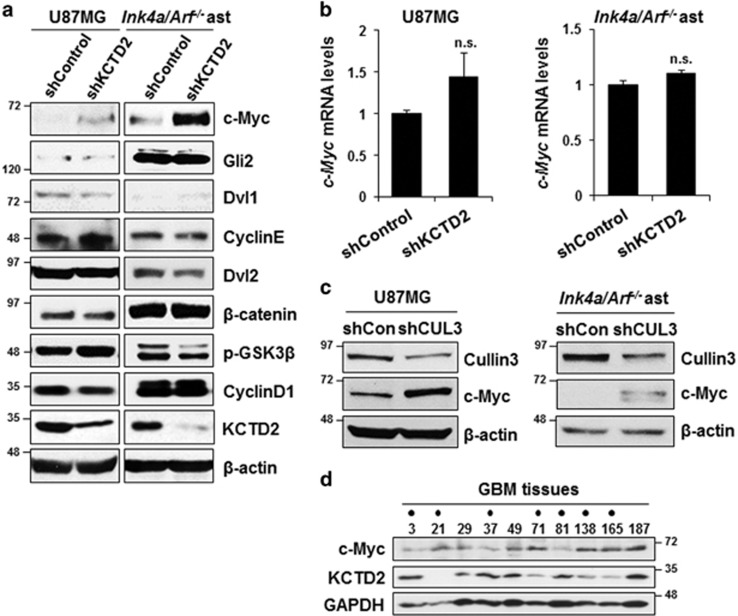
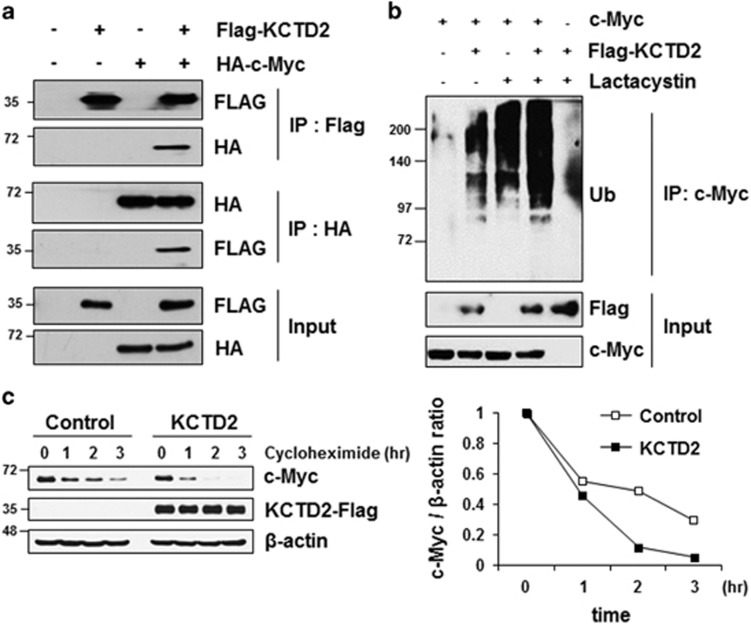
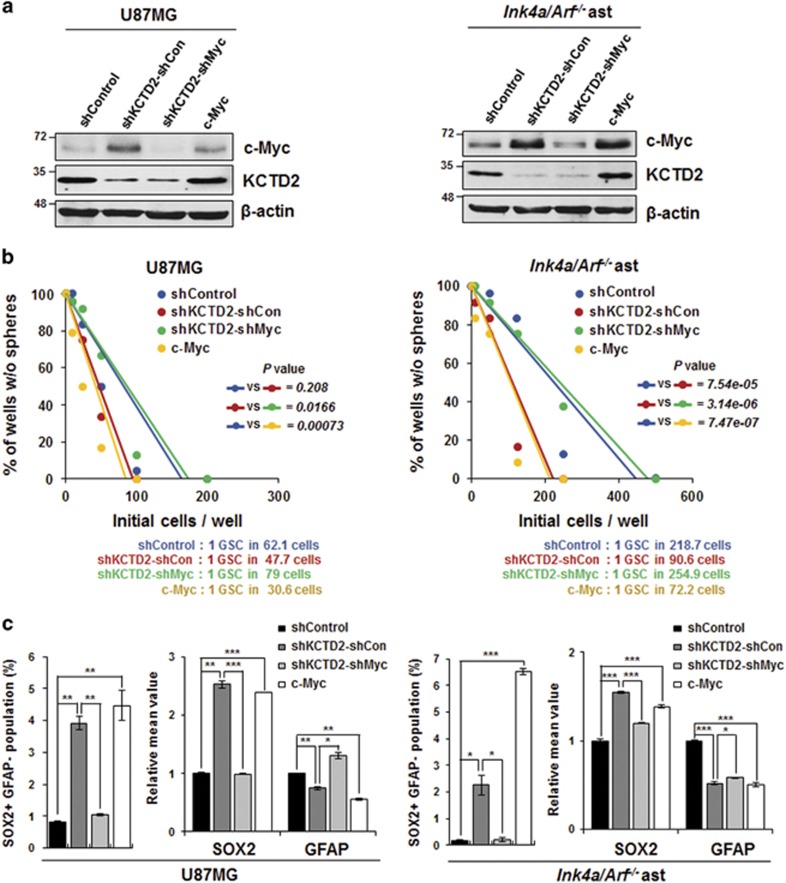
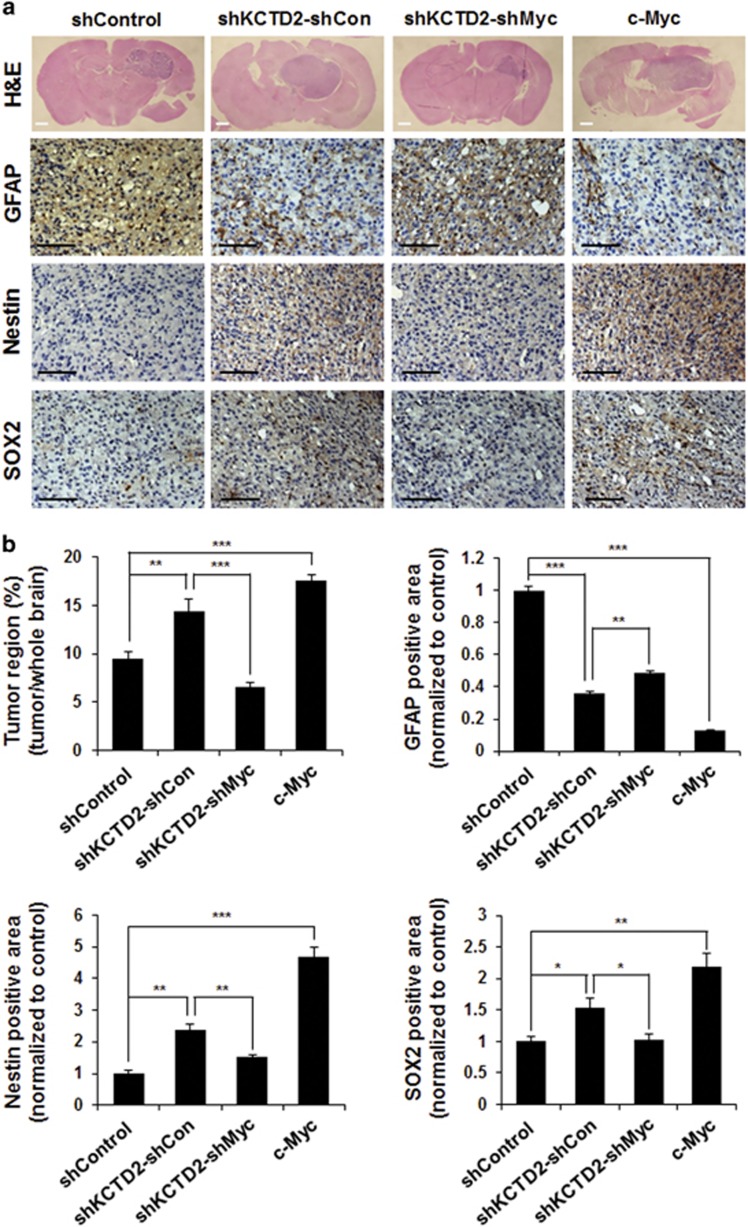
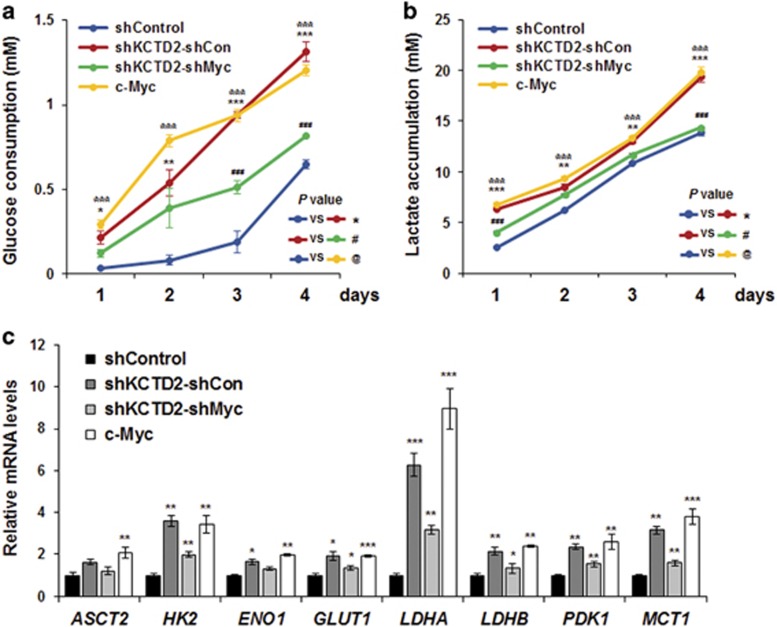
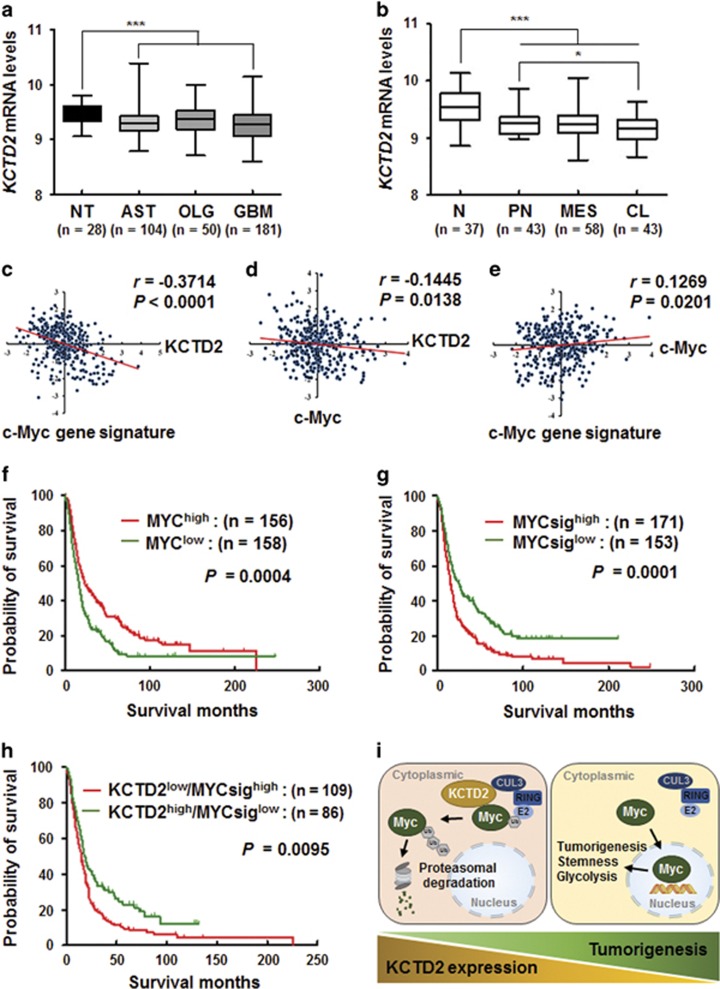
Cullin3 E3 ubiquitin ligase ubiquitinates a wide range of substrates through substrate-specific adaptors Bric-a-brac, Tramtrack, and Broad complex (BTB) domain proteins. These E3 ubiquitin ligase complexes are involved in diverse cellular functions. Our recent study demonstrated that decreased Cullin3 expression induces glioma initiation and correlates with poor prognosis of patients with malignant glioma. However, the substrate recognition mechanism associated with tumorigenesis is not completely understood. Through yeast two-hybrid screening, we identified potassium channel tetramerization domain-containing 2 (KCTD2) as a BTB domain protein that binds to Cullin3. The interaction of Cullin3 and KCTD2 was verified using immunoprecipitation and immunofluorescence. Of interest, KCTD2 expression was markedly decreased in patient-derived glioma stem cells (GSCs) compared with non-stem glioma cells. Depletion of KCTD2 using a KCTD2-specific short-hairpin RNA in U87MG glioma cells and primary Ink4a/Arf-deficient murine astrocytes markedly increased self-renewal activity in addition with an increased expression of stem cell markers, and mouse in vivo intracranial tumor growth. As an underlying mechanism for these KCTD2-mediated phenotypic changes, we demonstrated that KCTD2 interacts with c-Myc, which is a key stem cell factor, and causes c-Myc protein degradation by ubiquitination. As a result, KCTD2 depletion acquires GSC features and affects aerobic glycolysis via expression changes in glycolysis-associated genes through c-Myc protein regulation. Of clinical significance was our finding that patients having a profile of KCTD2 mRNA-low and c-Myc gene signature-high, but not KCTD2 mRNA-low and c-Myc mRNA-high, are strongly associated with poor prognosis. This study describes a novel regulatory mode of c-Myc protein in malignant gliomas and provides a potential framework for glioma therapy by targeting c-Myc function.


Conflict of interest statement

The authors declare no conflict of interest.

Figures

Figure 1
Figure 1
Identification of KCTD2 as an adaptor of Cullin3 E3 ubiquitin ligase. (a) Overlapping clone numbers of Cullin3-binding proteins. Y2H screening was performed using Cullin3 as bait and a human fetal brain cDNA library. A total of 100 positive colonies were sequenced, of which sequence data of 98 samples were used, and 2 samples failed to sequence. (b) Relative mRNA expression levels of the KCTD2, KCTD5, KCTD6, KCTD13, KCTD17, and BTBD6 genes were analyzed using transcriptome microarray data. Relative mRNA levels in astrocytes are set to 1. Normal astrocytes (n=4), GBMs (n=5), and GSCs (n=7). *P<0.05; **P<0.01; ***P<0.001. (c) Relative KCTD2 mRNA levels in 10 GSCs and 6 GBM cell lines examined using qRT-PCR. (d) Interaction between KCTD2 and Cullin3 shown using a combination of selection medium and β-gal activity was verified using one-on-one Y2H analysis. Colony formation indicates effective plasmid transformation and positive β-gal staining represents an interaction. (+) indicates a positive control (pGBKT7-p53 and pGADT7-SV40), (–) indicates a negative control (pGBKT7, which contains only the DNA binding domain), pGADT7 (which contains only the transactivation domain), and Cullin3-KCTD2 indicates pGBKT7-hCullin3 and pACT2-KCTD2. (e) Co-immunoprecipitation analysis was performed to determine an interaction between KCTD2 and Cullin3. pIRES-Cullin3 and pcDNA-Flag-KCTD2 plasmids were transfected in HEK 293 T cells. KCTD2 proteins were immunoprecipitated (IP) using an anti-Flag antibody followed by Cullin3 protein detection by western blot analysis using an anti-Cullin3 antibody. (f) Following transient transfection of pIRES-Cullin3 and pcDNA-Flag-KCTD2 plasmids in HEK 293 T cells, co-immunofluorescence analysis was performed to determine colocalization of KCTD2 (red) and Cullin3 (green). DAPI (blue) was used to stain nuclei. Scale bar represents 50 μm
Figure 2
Figure 2
KCTD2 depletion increases c-Myc protein levels but not c-Myc mRNA levels. (a) Expression of WNT and SHH signaling components and target genes in control (shControl) and KCTD2 knockdown (shKCTD2) in U87MG glioma cells and Ink4a/Arf−/− astrocytes were examined by western blot analysis. β-Actin was used as a loading control. (b) c-Myc mRNA levels in control (shControl) and KCTD2 knockdown (shKCTD2) in U87MG glioma cells and Ink4a/Arf−/− astrocytes were measured using qRT-PCR. NS indicates no significance. (c) Expression levels of c-Myc protein in control (shCon) and Cullin3 knockdown (shCul3) in U87MG glioma cells and Ink4a/Arf−/− astrocytes were examined by western blot analysis. β-Actin was used as a loading control. (d) Expression levels of KCTD2 and c-Myc proteins in protein extracts from GBM patient specimens were determined by western blot analysis. A closed dot (•) indicates GBM samples with a negative correlation between KCTD2 and c-Myc expression. Glyceraldehyde 3-phosphate dehydrogenase (GAPDH) was used as a loading control
Figure 3
Figure 3
KCTD2 interacts and degrades c-Myc protein. (a) pcDNA-HA-c-Myc and pcDNA-Flag-KCTD2 plasmids were transfected in HEK 293 T cells. Co-immunoprecipitation analysis was performed to examine interaction between KCTD2 and c-Myc. c-Myc protein was immunoprecipitated (IP) using an anti-HA antibody followed by KCTD2 detection by western blot analysis using an anti-Flag antibody. KCTD2 protein was immunoprecipitated using an anti-Flag antibody followed by c-Myc protein detection by western blot analysis using an anti-HA antibody. (b) Following plasmid transfection in HEK 293 T cells, polyubiquitination of c-Myc by KCTD2 was examined using western blot analysis. Cells were treated with DMSO or lactacystin (10 μM) for 6 h before protein extraction. (c) Reduction in c-Myc protein stability by ectopic KCTD2 expression in HEK 293 T cells was determined using a cycloheximide (CHX) chase assay. Quantitative values of the remaining c-Myc protein were measured using Image J software
Figure 4
Figure 4
KCTD2 depletion regulates GSC characteristics through increases in c-Myc protein. (a) Expression levels of KCTD2 and c-Myc in U87MG glioma cells and Ink4a/Arf−/−astrocytes were examined using western blot analysis. β-Actin was used as a loading control. (b) Tumorsphere-forming abilities of U87MG glioma cells and Ink4a/Arf−/− astrocytes were determined using an in vitro limiting dilution assay. (c) Relative expression levels of the GSC marker SOX2 and the differentiated astrocyte marker GFAP in U87MG cells and Ink4a/Arf−/−astrocytes as examined by FACS analysis. Evaluation of the cancer stem-like cells were assign using SOX2-FITC-positive and GFAP-PE-negative population. *P<0.05; **P<0.01; ***P<0.001
Figure 5
Figure 5
KCTD2 depletion stimulates tumor growth as shown by an increase of the undifferentiated glioma cell population in vivo. (a) Representative H&E staining and immunohistochemistry data were obtained from mouse intracranial xenografts of the respective cells. Immunohistochemistry analysis showed expression of the differentiated astrocyte marker (GFAP) and the stem cell markers (Nestin and SOX2). White scale bar represents 500 μm and black scale bar represents 100 μm. (b) Quantitative data for tumor region (upper left) and positively stained areas of GFAP (upper right), Nestin (lower left), and SOX2 (lower right) were obtained from results shown in panel a. *P<0.05; **P<0.01; ***P<0.001
Figure 6
Figure 6
KCTD2 depletion induces aerobic glycolysis through c-Myc regulation. (a) Glucose levels in cells were determined using a GO assay kit at the indicated times. Glucose consumption was determined as the difference in glucose concentration in the culture medium compared with control. *, @, and #P<0.05; **, @@, and ## P<0.01; ***, @@@, and ###P<0.001. (b) Lactate concentration in culture medium of the indicated U87MG glioma cells was measured at the indicated time using an L-lactate assay kit. *, @, and # P<0.05; **, @@, and ## P<0.01; ***, @@@, and ### P<0.001. (c) The mRNA levels of glycolysis-related genes, ASCT2, HK2, ENO1, GLUT1, PDK1, LDHA, and MCT1, in the indicated U87MG glioma cells were measured using qRT-PCR. *P<0.05; **P<0.01; ***P<0.001
Figure 7
Figure 7
KCTD2 and c-Myc gene signature correlates with clinical outcomes of patients with malignant glioma. (a) Relative KCTD2 mRNA levels in non-tumor (NT), astrocytoma (AST), oligodendrocytoma (OLG), and GBM were obtained from the REMBRANDT data set. ***P<0.001. (b) Relative KCTD2 mRNA levels in four different GBM subtypes were analyzed using the REMBRANDT data set. Neural (N), Proneural (PN), Mesenchymal (MES), and Classical (CL). *P<0.05; ***P<0.001. (c) Correlation of KCTD2 mRNA levels versus c-Myc gene signature, (d) KCTD2 mRNA levels versus c-Myc mRNA levels, and (e) c-Myc mRNA levels versus c-Myc gene signature, were analyzed using the REMBRANDT data set. (f–h) Kaplan–Meier survival data of patients with malignant glioma were obtained from the REMBRANDT data set. Kaplan–Meier survival analysis was performed between patient groups based on: (f) c-Myc mRNA-high versus c-Myc mRNA-low, (g) c-Myc gene signature-high versus c-Myc gene signature-low, and (h) KCTD2 mRNA-low/c-Myc gene signature-high versus KCTD2 mRNA-high/c-Myc gene signature-low. (i) A schematic diagram showing c-Myc ubiquitination by Cullin3-KCTD2 complex in malignant gliomas

References

    1. Hershko A, Ciechanover A. The ubiquitin system. Annu Rev Biochem 1998; 67: 425–479. - PubMed
    1. Sarikas A, Hartmann T, Pan ZQ. The cullin protein family. Genome Biol 2011; 12: 220. - PMC - PubMed
    1. Genschik P, Sumara I, Lechner E. The emerging family of CULLIN3-RING ubiquitin ligases (CRL3s): cellular functions and disease implications. EMBO J 2013; 32: 2307–2320. - PMC - PubMed
    1. Furukawa M, He YJ, Borchers C, Xiong Y. Targeting of protein ubiquitination by BTB-Cullin 3-Roc1 ubiquitin ligases. Nat Cell Biol 2003; 5: 1001–1007. - PubMed
    1. Smaldone G, Pirone L, Balasco N, Di Gaetano S, Pedone EM, Vitagliano L. Cullin 3 recognition is not a universal property among KCTD proteins. PLoS One 2015; 10: e0126808. - PMC - PubMed

Publication types

MeSH terms

Substances