

Standardizing CT lung density measure across scanner manufacturers
- PMID: 28060414
- PMCID: PMC6276120
- DOI: 10.1002/mp.12087
Standardizing CT lung density measure across scanner manufacturers
Abstract
Purpose: Computed Tomography (CT) imaging of the lung, reported in Hounsfield Units (HU), can be parameterized as a quantitative image biomarker for the diagnosis and monitoring of lung density changes due to emphysema, a type of chronic obstructive pulmonary disease (COPD). CT lung density metrics are global measurements based on lung CT number histograms, and are typically a quantity specifying either the percentage of voxels with CT numbers below a threshold, or a single CT number below which a fixed relative lung volume, nth percentile, falls. To reduce variability in the density metrics specified by CT attenuation, the Quantitative Imaging Biomarkers Alliance (QIBA) Lung Density Committee has organized efforts to conduct phantom studies in a variety of scanner models to establish a baseline for assessing the variations in patient studies that can be attributed to scanner calibration and measurement uncertainty.
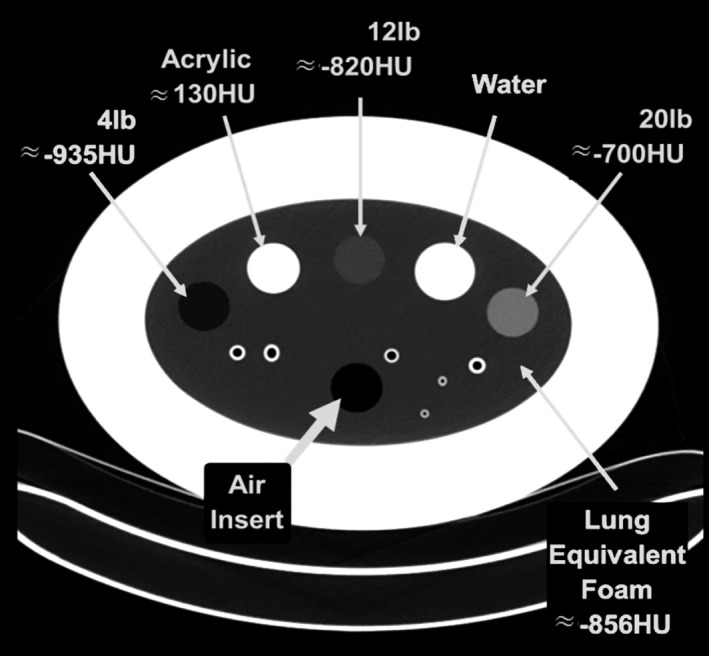
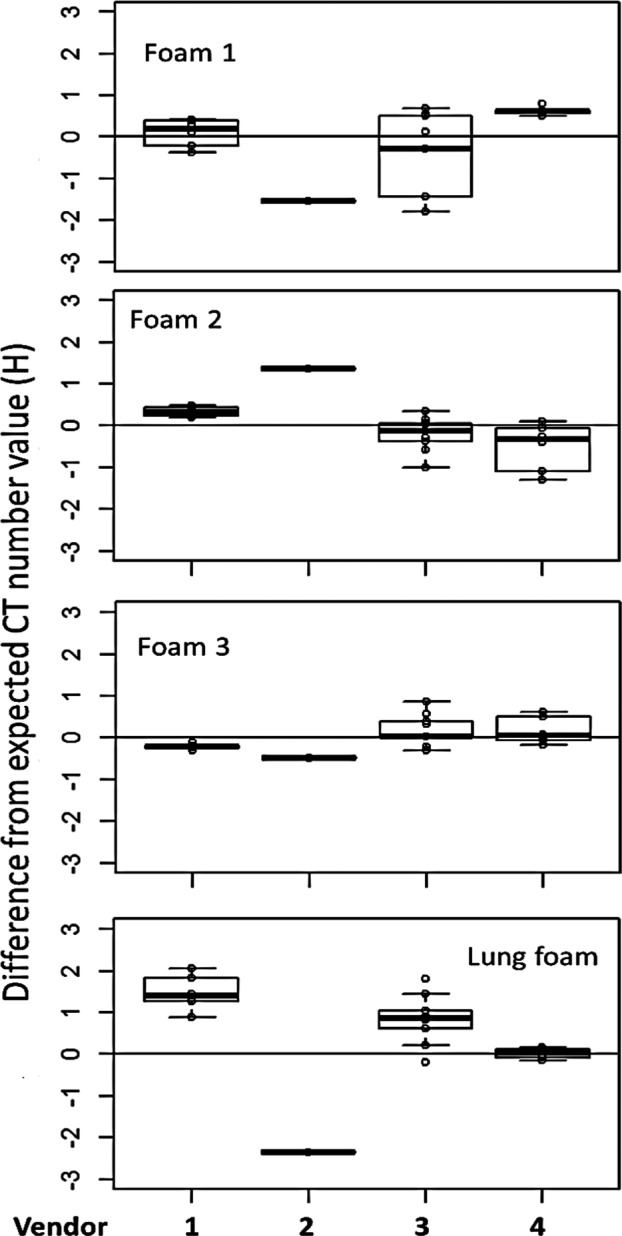
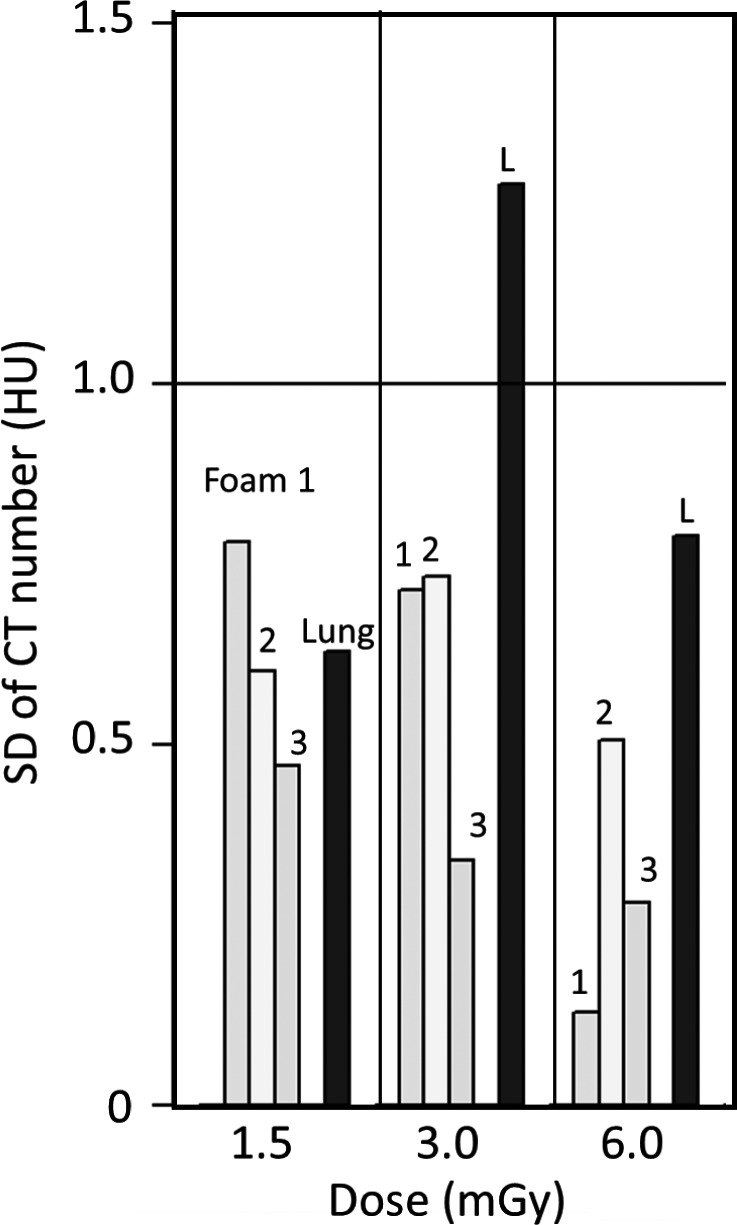
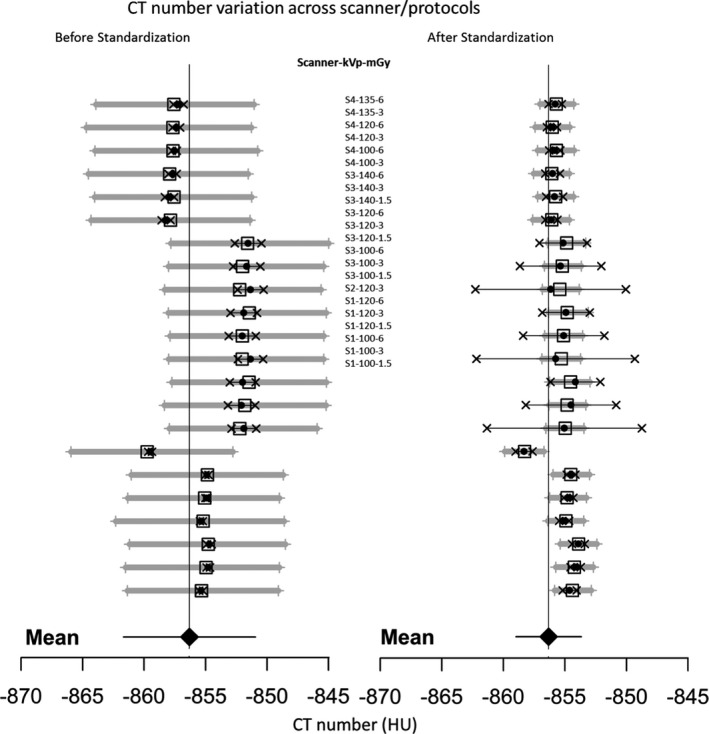
Methods: Data were obtained from a phantom study on CT scanners from four manufacturers with several protocols at various tube potential voltage (kVp) and exposure settings. Free from biological variation, these phantom studies provide an assessment of the accuracy and precision of the density metrics across platforms solely due to machine calibration and uncertainty of the reference materials. The phantom used in this study has three foam density references in the lung density region, which, after calibration against a suite of Standard Reference Materials (SRM) foams with certified physical density, establishes a HU-electron density relationship for each machine-protocol. We devised a 5-step calibration procedure combined with a simplified physical model that enabled the standardization of the CT numbers reported across a total of 22 scanner-protocol settings to a single energy (chosen at 80 keV). A standard deviation was calculated for overall CT numbers for each density, as well as by scanner and other variables, as a measure of the variability, before and after the standardization. In addition, a linear mixed-effects model was used to assess the heterogeneity across scanners, and the 95% confidence interval of the mean CT number was evaluated before and after the standardization.
Results: We show that after applying the standardization procedures to the phantom data, the instrumental reproducibility of the CT density measurement of the reference foams improved by more than 65%, as measured by the standard deviation of the overall mean CT number. Using the lung foam that did not participate in the calibration as a test case, a mixed effects model analysis shows that the 95% confidence intervals are [-862.0 HU, -851.3 HU] before standardization, and [-859.0 HU, -853.7 HU] after standardization to 80 keV. This is in general agreement with the expected CT number value at 80 keV of -855.9 HU with 95% CI of [-857.4 HU, -854.5 HU] based on the calibration and the uncertainty in the SRM certified density.
Conclusions: This study provides a quantitative assessment of the variations expected in CT lung density measures attributed to non-biological sources such as scanner calibration and scanner x-ray spectrum and filtration. By removing scanner-protocol dependence from the measured CT numbers, higher accuracy and reproducibility of quantitative CT measures were attainable. The standardization procedures developed in study may be explored for possible application in CT lung density clinical data.
Keywords: COPD; CT scanner calibration; Hounsfield Unit correction; Quantitative Imaging Biomarker; lung density CT; lung density SRM; lung density reference phantom.
© 2017 American Association of Physicists in Medicine.
Conflict of interest statement
H. Chen‐Mayer and A. Possolo are federal employees and have no conflict of interest to disclose. S. Fain has research funding from GE Healthcare to develop pulmonary MRI techniques. B. Hoppel is an employee of Toshiba Medical Research Institute USA and has financial interest with GE Healthcare. M. Fuld is an employee of Siemens Healthcare for medical device equipment and software. J. Sieren is an employee and shareholder of VIDA Diagnostics Inc., a medical software company. J. Guo is a shareholder in VIDA Diagnostics.
Figures


References
-
- Dirksen A, Friis M, Olesen KP, Skovgaard LT, Sorensen K. Progress of emphysema in severe α1‐antitrypsin deficiency as assessed by annual CT. Acta Radiol. 1997;38:826–832. - PubMed
-
- Coxson HO, Leipsic J, Parraga G, Sin DD. Using pulmonary imaging to move chronic obstructive pulmonary disease beyond FEV1. Am J Respir Crit Care Med. 2014;190:2135–2144. - PubMed
-
- Madani A, Zanen J, De Maertelaer V, Gevenois PA. Pulmonary emphysema: objective quantification at multi‐detector row CT: comparison with macroscopic and microscopic morphometry. Radiology. 2006;238:1036–1043. - PubMed
MeSH terms
Grants and funding
LinkOut - more resources
Full Text Sources
Other Literature Sources
Medical
