. 2017 Jan 6;12(1):e0169719.
doi: 10.1371/journal.pone.0169719. eCollection 2017.

Preference of Conjugated Bile Acids over Unconjugated Bile Acids as Substrates for OATP1B1 and OATP1B3

Affiliations

Preference of Conjugated Bile Acids over Unconjugated Bile Acids as Substrates for OATP1B1 and OATP1B3

Takahiro Suga et al. PLoS One. .

Abstract

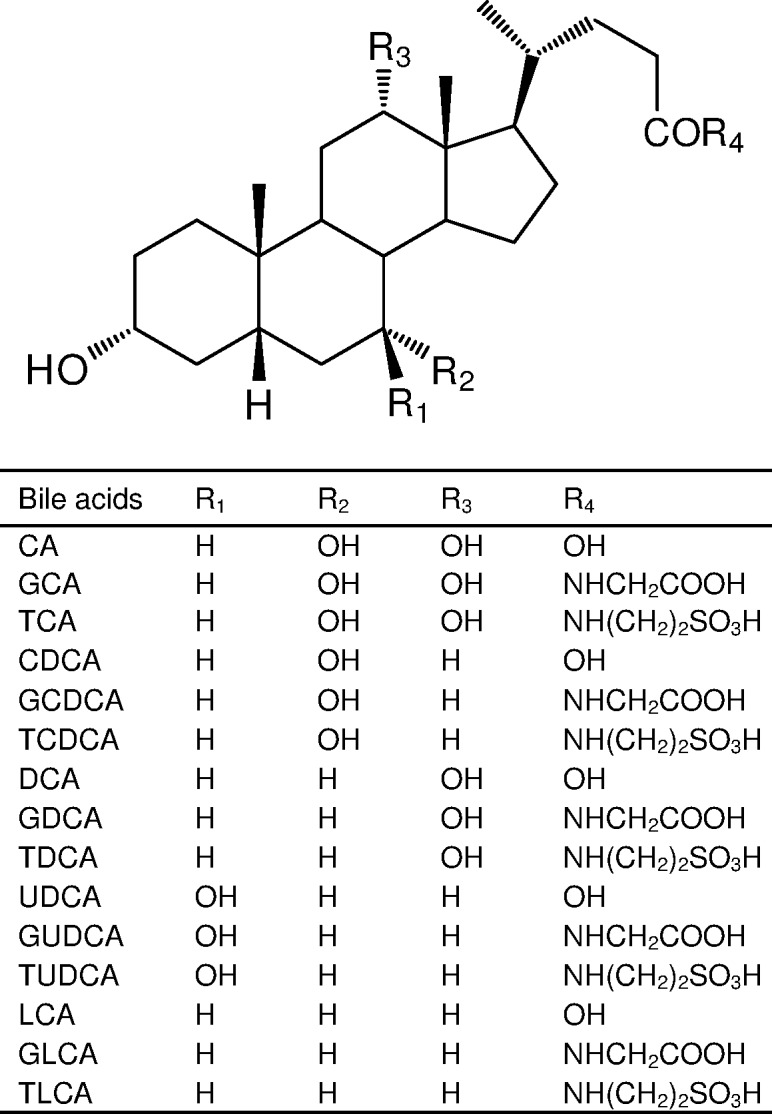
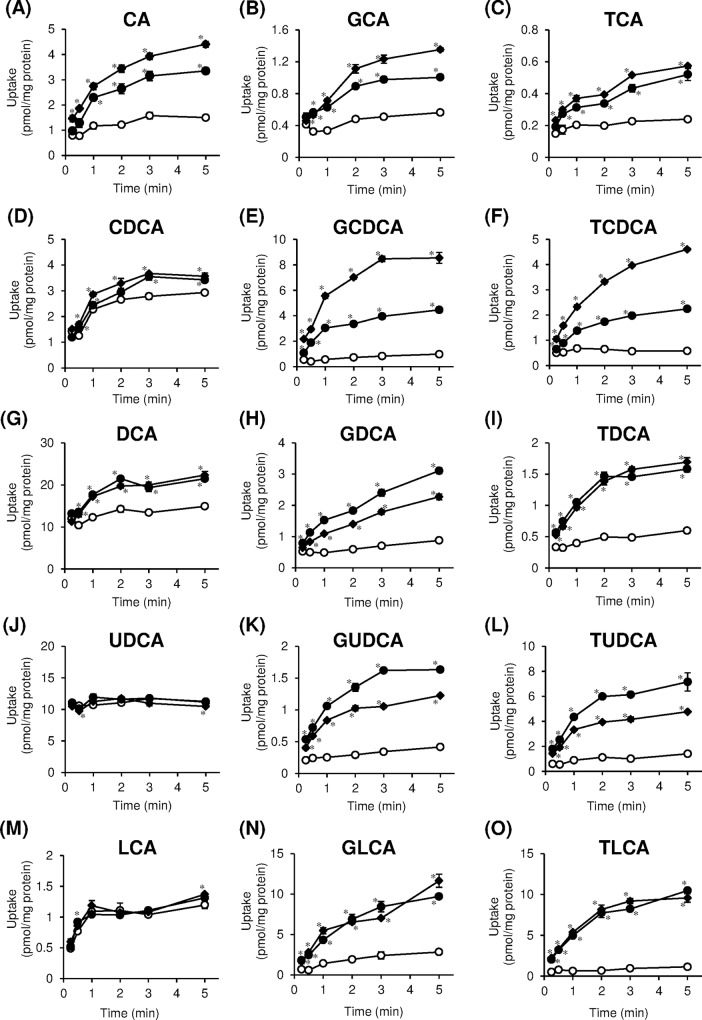
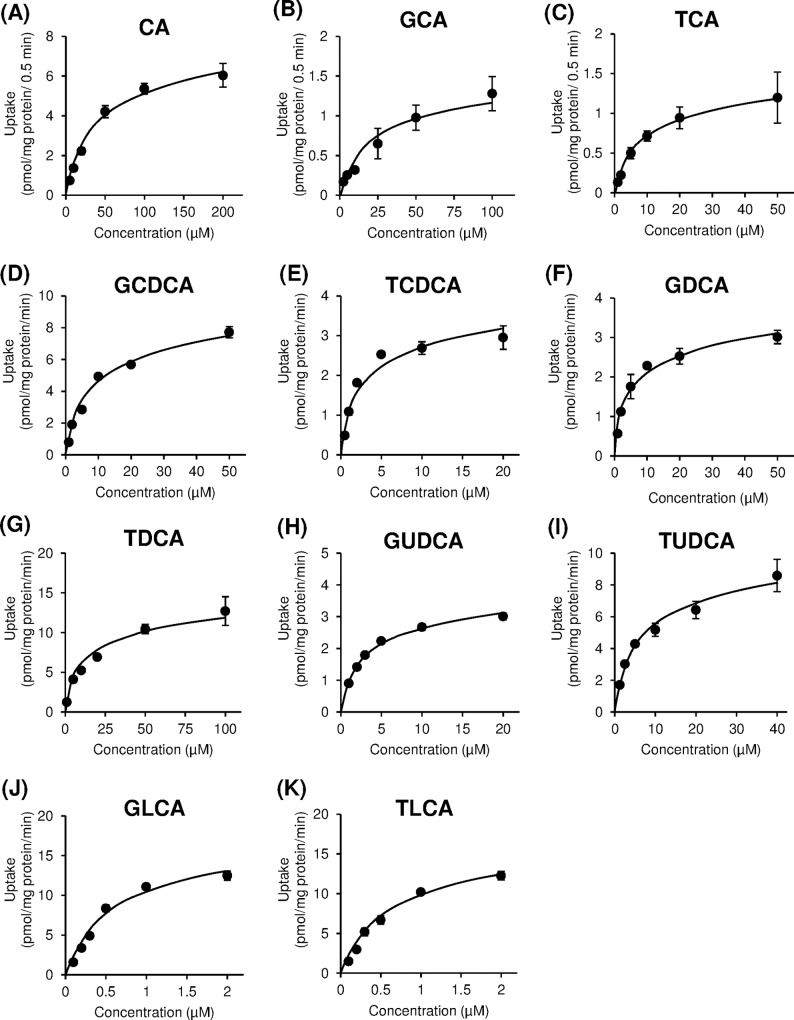
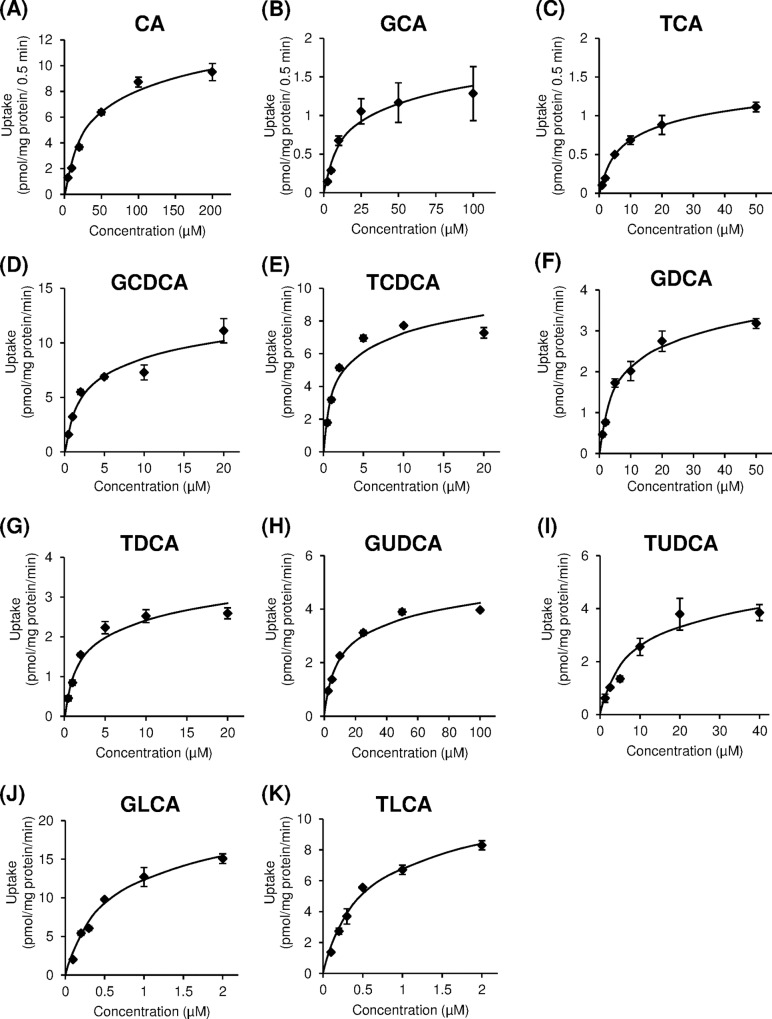
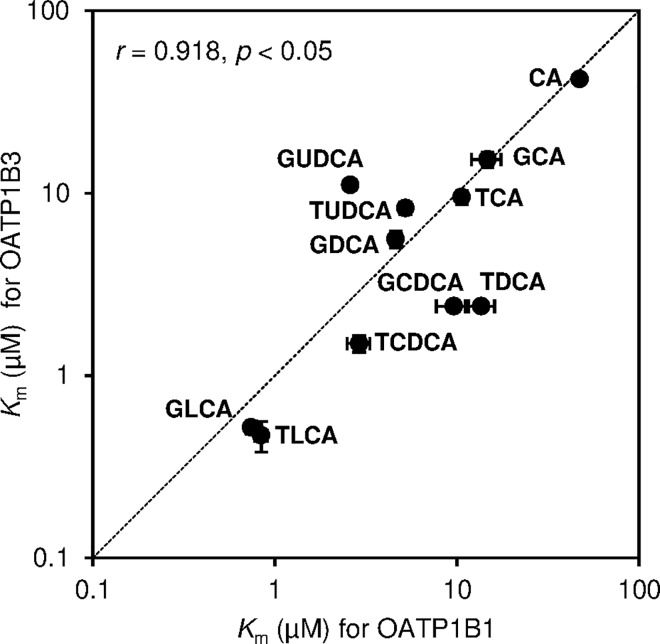
Bile acids, the metabolites of cholesterol, are signaling molecules that play critical role in many physiological functions. They undergo enterohepatic circulation through various transporters expressed in intestine and liver. Human organic anion-transporting polypeptides (OATP) 1B1 and OATP1B3 contribute to hepatic uptake of bile acids such as taurocholic acid. However, the transport properties of individual bile acids are not well understood. Therefore, we selected HEK293 cells overexpressing OATP1B1 and OATP1B3 to evaluate the transport of five major human bile acids (cholic acid, chenodeoxycholic acid, deoxycholic acid, ursodeoxycholic acid, lithocholic acid) together withtheir glycine and taurine conjugates via OATP1B1 and OATP1B3. The bile acids were quantified by liquid chromatography-tandem mass spectrometry. The present study revealed that cholic acid, chenodeoxyxcholic acid, and deoxycholic acid were transported by OATP1B1 and OATP1B3, while ursodeoxycholic acid and lithocholic acid were not significantly transported by OATPs. However, all the conjugated bile acids were taken up rapidly by OATP1B1 and OATP1B3. Kinetic analyses revealed the involvement of saturable OATP1B1- and OATP1B3-mediated transport of bile acids. The apparent Km values for OATP1B1 and OATP1B3 of the conjugated bile acids were similar (0.74-14.7 μM for OATP1B1 and 0.47-15.3 μM for OATP1B3). They exhibited higher affinity than cholic acid (47.1 μM for OATP1B1 and 42.2 μM for OATP1B3). Our results suggest that conjugated bile acids (glycine and taurine) are preferred to unconjugated bile acids as substrates for OATP1B1 and OATP1B3.


Conflict of interest statement

The authors have declared that no competing interests exist.

Figures

Fig 1
Fig 1. Chemical structures of bile acids.
Fig 2
Fig 2. Time-dependent uptake of bile acids by organic anion-transporting polypeptides (OATP) 1B1 and OATP1B3.
OATP1B1-overexpressing (closed circles), OATP1B3-overexpressing (closed diamonds), and vector-transfected (open circles) HEK293 cells were incubated for indicated times at 37°C. (A) CA (5 μM), (B) GCA (2.5 μM), (C) TCA (1 μM), (D) CDCA (0.1 μM), (E) GCDCA (1 μM), (F) TCDCA (0.5 μM), (G) DCA (1 μM), (H) GDCA (1 μM), (I) TDCA (1 μM), (J) UDCA (1 μM), (K) GUDCA (1 μM), (L) TUDCA (2.5 μM), (M) LCA (0.01 μM), (N) GLCA (0.2 μM), (O) TLCA (0.2 μM). Each point represents the mean±S.E. (n = 3). *p < 0.05, significantly different from vector-transfected cells by Student’s t-test.
Fig 3
Fig 3. Concentration-dependent uptake of bile acids by organic anion-transporting polypeptide (OATP) 1B1.
OATP1B1-overexpressing HEK293 cells were incubated with bile acids at indicated concentrations at 37°C. Each point represents the mean±S.E. (n = 3).
Fig 4
Fig 4. Concentration-dependent uptake of bile acids by organic anion-transporting polypeptide (OATP) 1B3.
OATP1B3-overexpressing HEK293 cells were incubated with bile acids at indicated concentrations at 37°C. Each point represents the mean±S.E. (n = 3).
Fig 5
Fig 5. Correlation in Km values of bile acids for organic anion-transporting polypeptide (OATP) 1B1 and OATP1B3.
Km values of bile acids for OATP1B1 are shown on the X-axis and those for OATP1B3 are shown on the Y-axis. Dotted line in the graph represents 1:1 correlation. Each point represents the mean±S.E. (n = 3).

References

    1. de Aguiar Vallim TQ, Tarling EJ, Edwards PA. Pleiotropic roles of bile acids in metabolism. Cell Metab. 2013;17(5):657–69. Epub 2013/04/23. PubMed Central PMCID: PMCPMC3654004. 10.1016/j.cmet.2013.03.013 - DOI - PMC - PubMed
    1. Thomas C, Gioiello A, Noriega L, Strehle A, Oury J, Rizzo G, et al. TGR5-mediated bile acid sensing controls glucose homeostasis. Cell Metab. 2009;10(3):167–77. Epub 2009/09/03. PubMed Central PMCID: PMCPMC2739652. 10.1016/j.cmet.2009.08.001 - DOI - PMC - PubMed
    1. Watanabe M, Houten SM, Mataki C, Christoffolete MA, Kim BW, Sato H, et al. Bile acids induce energy expenditure by promoting intracellular thyroid hormone activation. Nature. 2006;439(7075):484–9. Epub 2006/01/10. 10.1038/nature04330 - DOI - PubMed
    1. Kawamata Y, Fujii R, Hosoya M, Harada M, Yoshida H, Miwa M, et al. A G protein-coupled receptor responsive to bile acids. J Biol Chem. 2003;278(11):9435–40. Epub 2003/01/14. 10.1074/jbc.M209706200 - DOI - PubMed
    1. Wang YD, Chen WD, Yu D, Forman BM, Huang W. The G-protein-coupled bile acid receptor, Gpbar1 (TGR5), negatively regulates hepatic inflammatory response through antagonizing nuclear factor kappa light-chain enhancer of activated B cells (NF-kappaB) in mice. Hepatology. 2011;54(4):1421–32. Epub 2011/07/08. PubMed Central PMCID: PMCPMC3184183. 10.1002/hep.24525 - DOI - PMC - PubMed

MeSH terms

Substances

LinkOut - more resources