

High rates of multidrug-resistant and rifampicin-resistant tuberculosis among re-treatment cases: where do they come from?
- PMID: 28061832
- PMCID: PMC5217596
- DOI: 10.1186/s12879-016-2171-1
High rates of multidrug-resistant and rifampicin-resistant tuberculosis among re-treatment cases: where do they come from?
Abstract
Background: Globally 3.9% of new and 21% of re-treatment tuberculosis (TB) cases are multidrug-resistant or rifampicin-resistant (MDR/RR), which is often interpreted as evidence that drug resistance results mainly from poor treatment adherence. This study aims to assess the respective contributions of the different causal pathways leading to MDR/RR-TB at re-treatment.
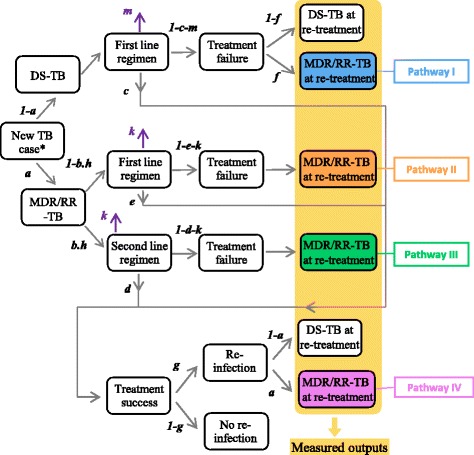
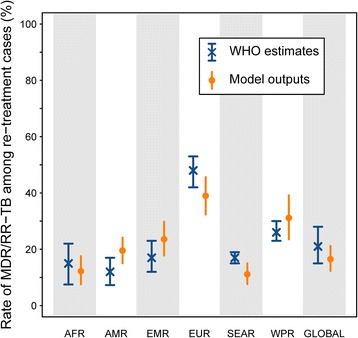
Methods: We use a simple mathematical model to simulate progression between the different stages of disease and treatment for patients diagnosed with TB. The model is parameterised using region and country-specific TB disease burden data reported by the World Health Organization (WHO). The contributions of four separate causal pathways to MDR/RR-TB among re-treatment cases are estimated: I) initial drug-susceptible TB with resistance amplification during treatment; II) initial MDR/RR-TB inappropriately treated as drug-susceptible TB; III) MDR/RR-TB relapse despite appropriate treatment; and IV) re-infection with MDR/RR-TB.
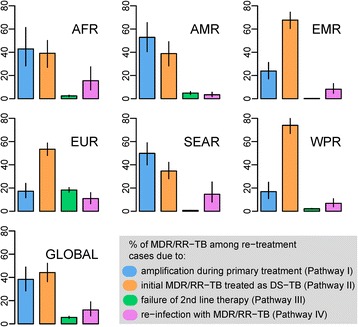
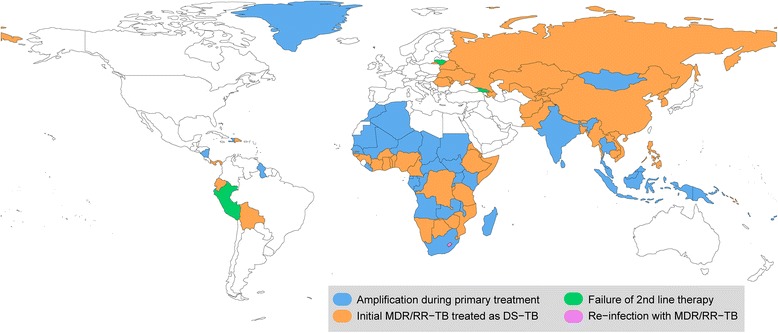
Results: At the global level, Pathways I, II, III and IV contribute 38% (28-49, 95% Simulation Interval), 44% (36-52, 95% SI), 6% (5-7, 95% SI) and 12% (7-19, 95% SI) respectively to the burden of MDR/RR-TB among re-treatment cases. Pathway II is dominant in the Western Pacific (74%; 67-80 95% SI), Eastern Mediterranean (68%; 60-74 95% SI) and European (53%; 48-59 95% SI) regions, while Pathway I makes the greatest contribution in the American (53%; 40-66 95% SI), African (43%; 28-61 95% SI) and South-East Asian (50%; 40-59 95% SI) regions.
Conclusions: Globally, failure to diagnose MDR/RR-TB at first presentation is the leading cause of the high proportion of MDR/RR-TB among re-treatment cases. These findings highlight the need for contextualised solutions to limit the impact and spread of MDR/RR-TB.
Keywords: Causal pathway; Drug resistance amplification; Inappropriate therapy; Misdiagnosis; Multidrug-resistant tuberculosis; Re-treatment; Tuberculosis.
Figures
References
-
- CDC Emergence of Mycobacterium tuberculosis with Extensive Resistance to Second-Line Drugs -Worldwide, 2000–2004. Morb Mortal Wkly Rep. 2006;55(11):301–5. - PubMed
-
- WHO. Global Tuberculosis Report 2016. Geneva, Switzerland: World Health Organization; 2016.
-
- Chiang CY, Schaaf HS. Management of drug-resistant tuberculosis. Int J Tuberc Lung Dis. 2010;14(6):672–82. - PubMed
-
- Mitchison DA. How drug resistance emerges as a result of poor compliance during short course chemotherapy for tuberculosis. Int J Tuberc Lung Dis. 1998;2(1):10–5. - PubMed
MeSH terms
Substances
LinkOut - more resources
Full Text Sources
Other Literature Sources
