. 2017 Jan 7;10(1):30.
doi: 10.1186/s13104-016-2340-8.

treeman: an R package for efficient and intuitive manipulation of phylogenetic trees

Affiliations

treeman: an R package for efficient and intuitive manipulation of phylogenetic trees

Dominic J Bennett et al. BMC Res Notes. .

Abstract

Background: Phylogenetic trees are hierarchical structures used for representing the inter-relationships between biological entities. They are the most common tool for representing evolution and are essential to a range of fields across the life sciences. The manipulation of phylogenetic trees-in terms of adding or removing tips-is often performed by researchers not just for reasons of management but also for performing simulations in order to understand the processes of evolution. Despite this, the most common programming language among biologists, R, has few class structures well suited to these tasks.

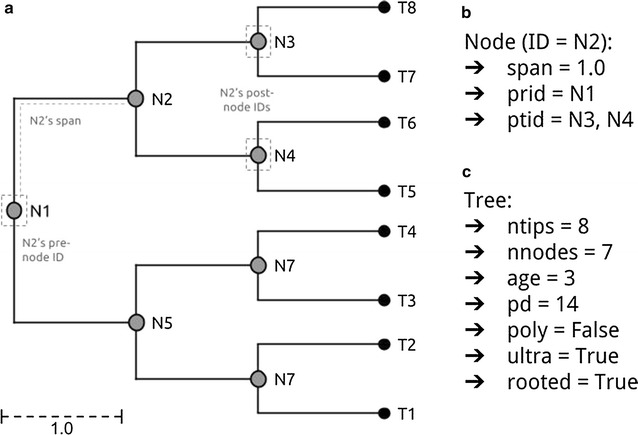
Results: We present an R package that contains a new class, called TreeMan, for representing the phylogenetic tree. This class has a list structure allowing phylogenetic trees to be manipulated more efficiently. Computational running times are reduced because of the ready ability to vectorise and parallelise methods. Development is also improved due to fewer lines of code being required for performing manipulation processes.

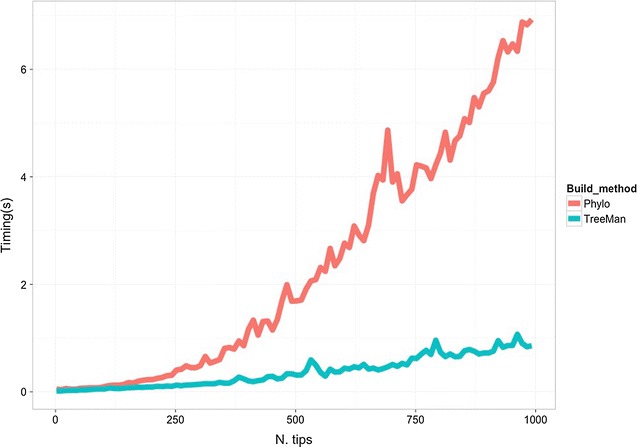
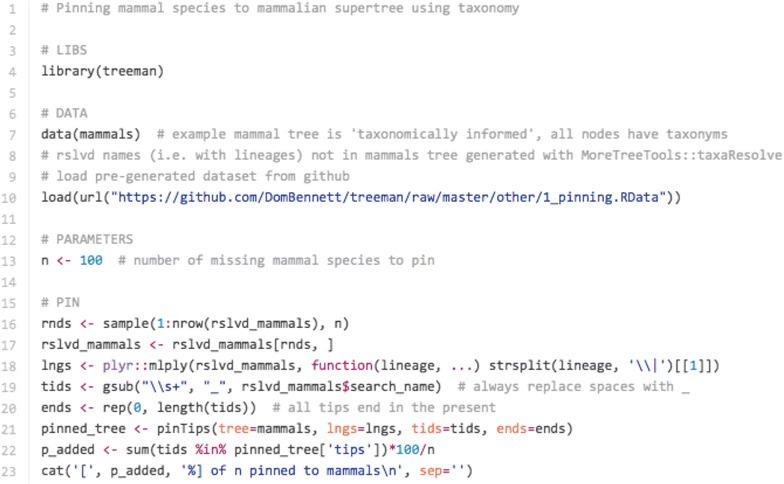
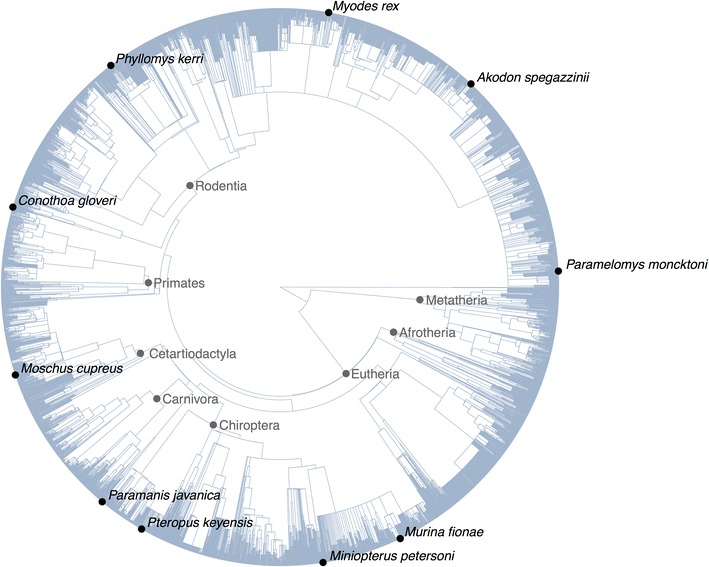
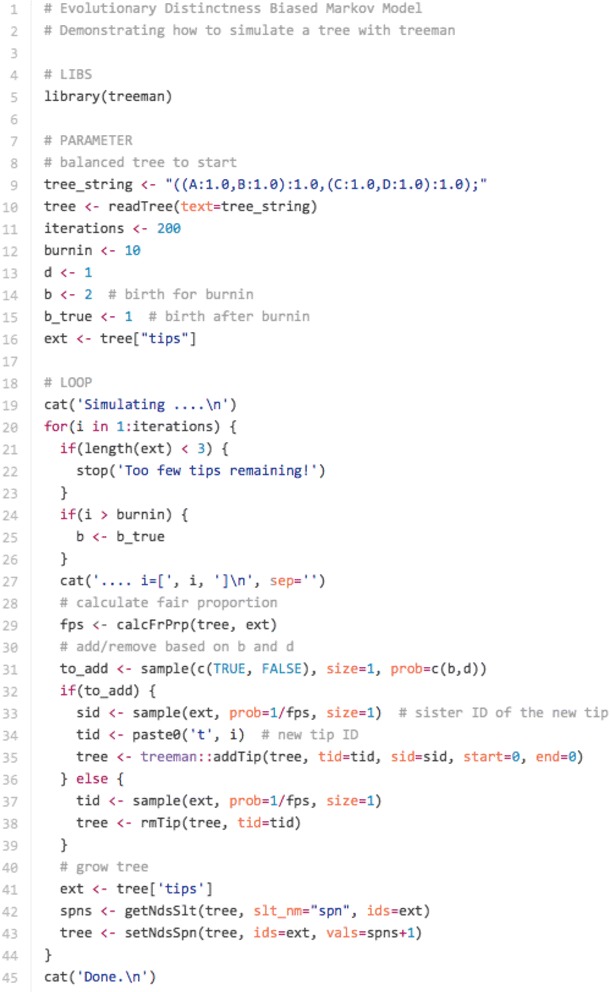
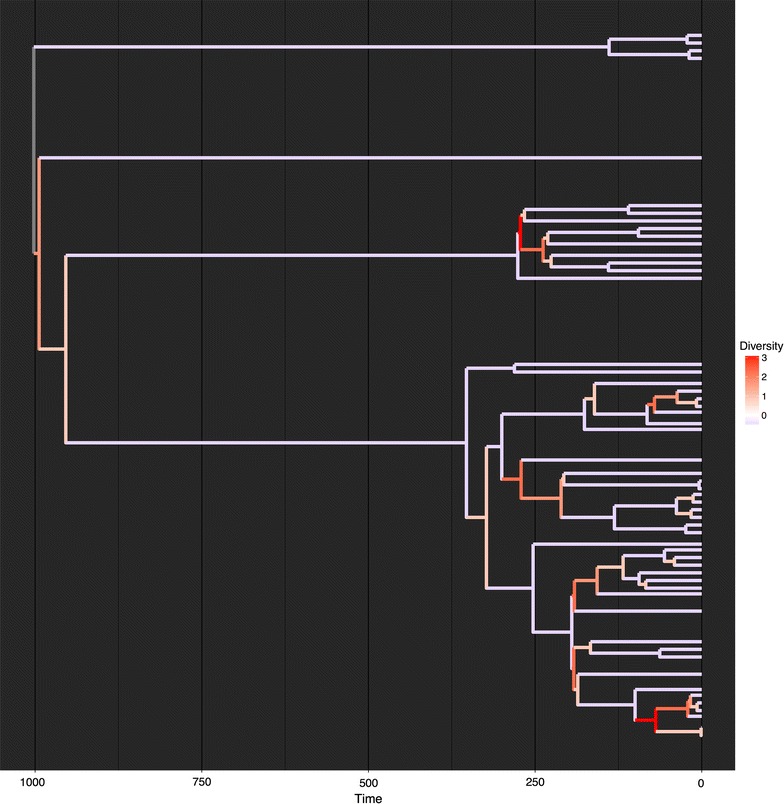
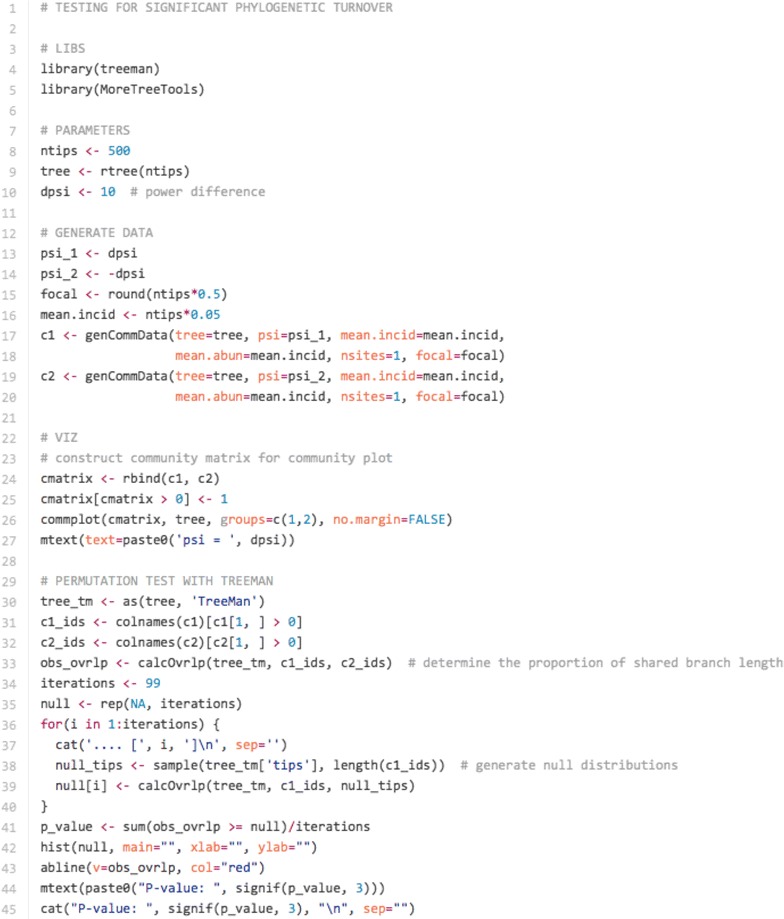
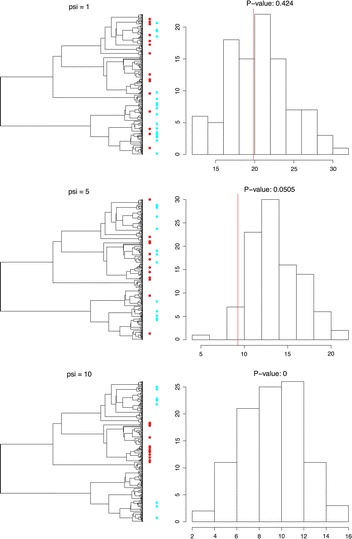
Conclusions: We present three use cases-pinning missing taxa to a supertree, simulating evolution with a tree-growth model and detecting significant phylogenetic turnover-that demonstrate the new package's speed and simplicity.

Keywords: Evolution; Phylogenetic trees; R; Statistical computing; Tree simulation.


Figures

Fig. 1
Fig. 1
Representation of simple tree as TreeMan object: an eight-tipped tree with node and tip IDs annotated and N2′s key slots identified, b representation of printed Node information for N2, c representation of printed TreeMan information
Fig. 2
Fig. 2
Comparison of tree building using APE’s phylo and treeman’s TreeMan classes. Starting with trees of two tips, 1000 new tips were added to the trees and the time taken to run the process was recorded every ten tips. The rate of increase in time taken for larger trees increases faster for the phylo class than TreeMan
Fig. 3
Fig. 3
Code snippet used to generated “pinned” tree: load mammal supertree that comes with the treeman package, load resolved names of missing taxa pre-generated with MoreTreeTools, select 100 names at random, pin using pinTips()
Fig. 4
Fig. 4
Mammalian supertree [15] showing ten tips that have been “pinned” using taxonomically constrained random placement
Fig. 5
Fig. 5
Code snippet for running EDBMM with treeman: read in balanced tree and set parameters for simulation; in loop, calculate fair proportion measure of evolutionary distinctness and add or remove tips based on these values; finally, extend the tip edges by adding 1
Fig. 6
Fig. 6
Phylogenetic tree simulated using an Evolutionary Distinctness Biased Markov Model (EDBMM), where tips with greater ED have lower rates of speciation and extinction. Branch colours indicate the local number of descending branches, in this case the number of descendants within 20 branch length units
Fig. 7
Fig. 7
Code snippet for calculating overlap between two different communities using treeman and MoreTreeTool: generate random communities using parameters of community overlap for a random tree, plot as community trees (see Fig. 8), convert trees from phylo to TreeMan using MoreTreeTool [24] ’s as(), generate null communities to test whether the two communities have significant overlap
Fig. 8
Fig. 8
Using calcOvrlp() to test for phylogenetic turnover. Left, phylogenetic trees with distributions of taxa found in two non-overlapping communities (red and blue) randomly generated with phylogenetic distance bias. The strength of this bias is determined by psi; greater psi leads to reduced overlap between communities. Right, distribution of 99 iterations for null communities’ overlap in phylogenetic diversity with red community. Red line indicates observed overlap between red and blue communities

References

    1. Paradis E, Blomberg S, Bolker B, Claude J, Cuong HS, Desper R, Didier G, Durand B, Dutheil J, Gascuel O. ape: Analyses of phylogenetics and evolution. 2016. https://cran.r-project.org/web/packages/ape/index.html. Accessed 24 Feb 2016.
    1. Paradis E, Claude J, Strimmer K. APE: analyses of phylogenetics and evolution in R language. Bioinformatics. 2004;20(2):289–290. doi: 10.1093/bioinformatics/btg412. - DOI - PubMed
    1. Schliep KP. phangorn: phylogenetic analysis in R. Bioinformatics. 2011;27(4):592–593. doi: 10.1093/bioinformatics/btq706. - DOI - PMC - PubMed
    1. Revell LJ. phytools: an R package for phylogenetic comparative biology (and other things) Methods Ecol Evol. 2012;3:217–223. doi: 10.1111/j.2041-210X.2011.00169.x. - DOI
    1. Michonneau F. phylobase: Base package for phylogenetic structures and comparative data. 2016. https://cran.r-project.org/web/packages/phylobase/index.html. Accessed 3 Sep 2016.