. 2017:582:387-414.
doi: 10.1016/bs.mie.2016.09.038. Epub 2016 Dec 7.

Subangstrom Measurements of Enzyme Function Using a Biological Nanopore, SPRNT

Affiliations

Subangstrom Measurements of Enzyme Function Using a Biological Nanopore, SPRNT

A H Laszlo et al. Methods Enzymol. 2017.

Abstract

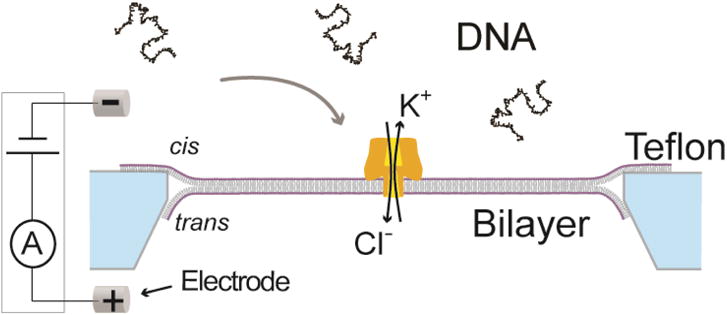
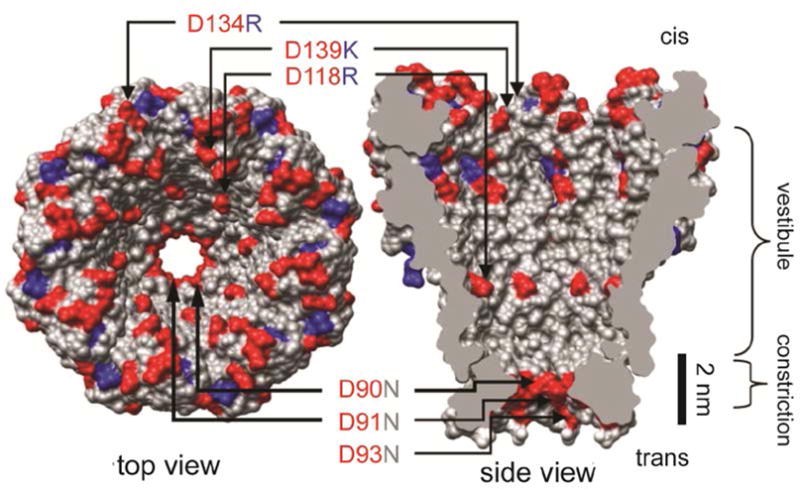
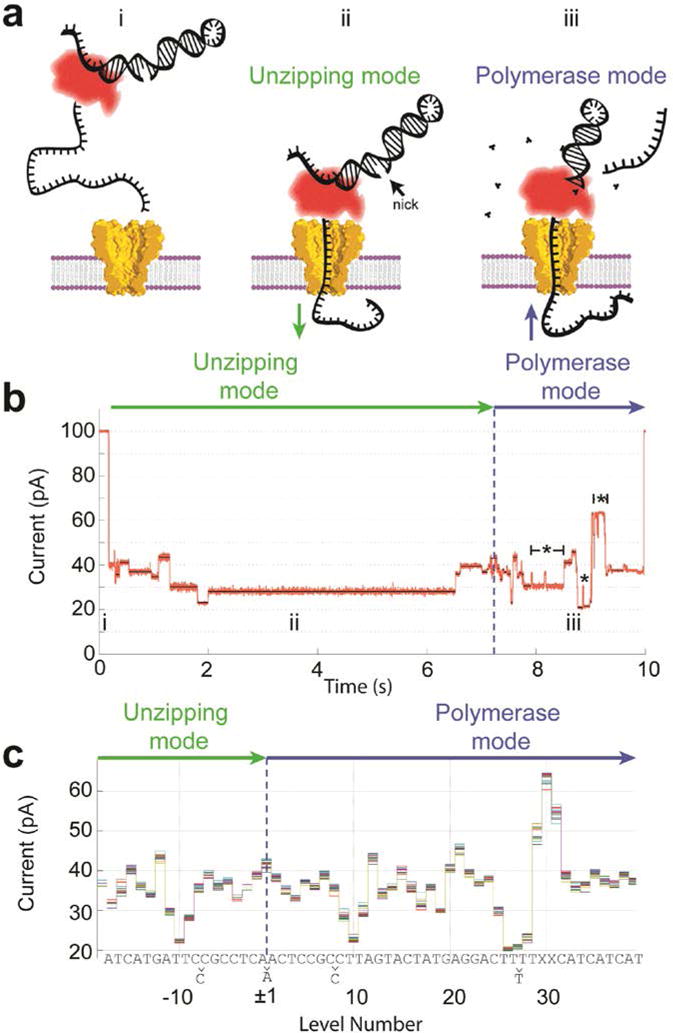
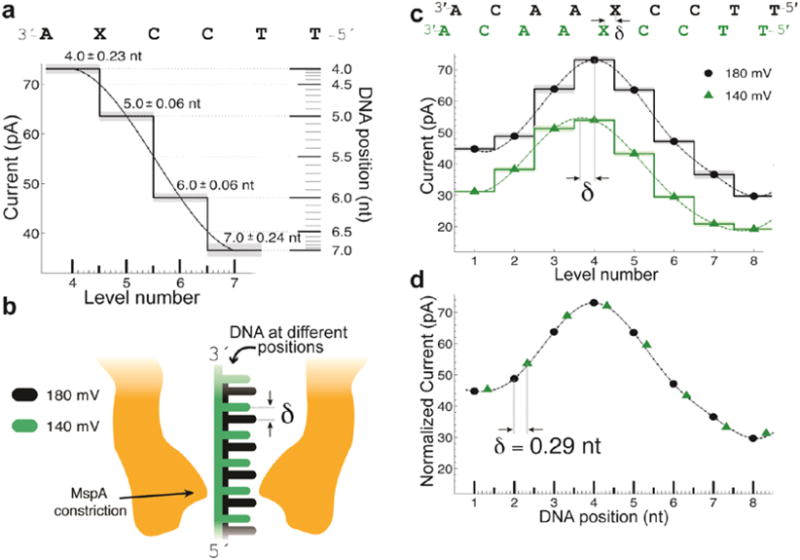
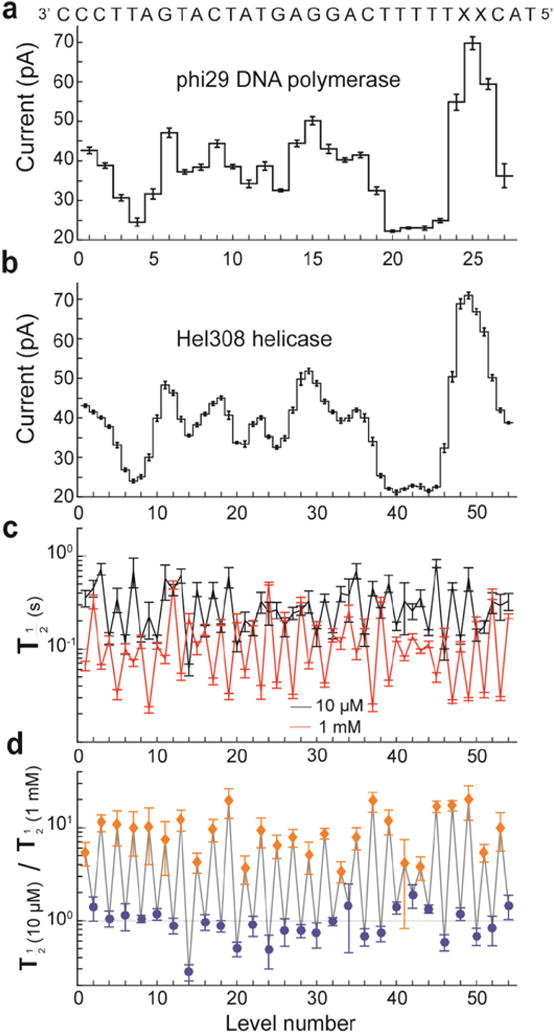
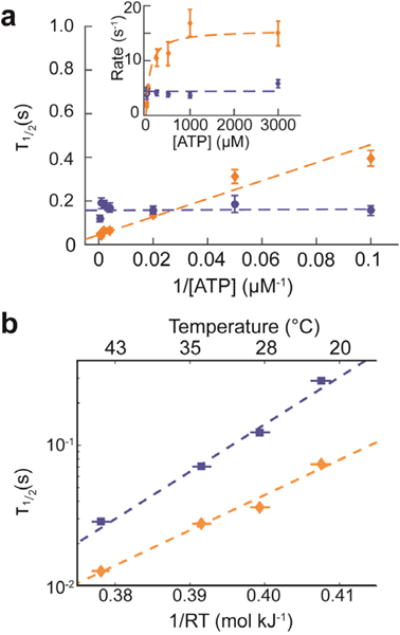
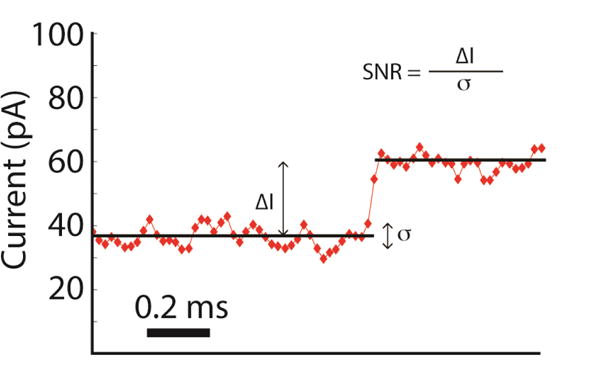
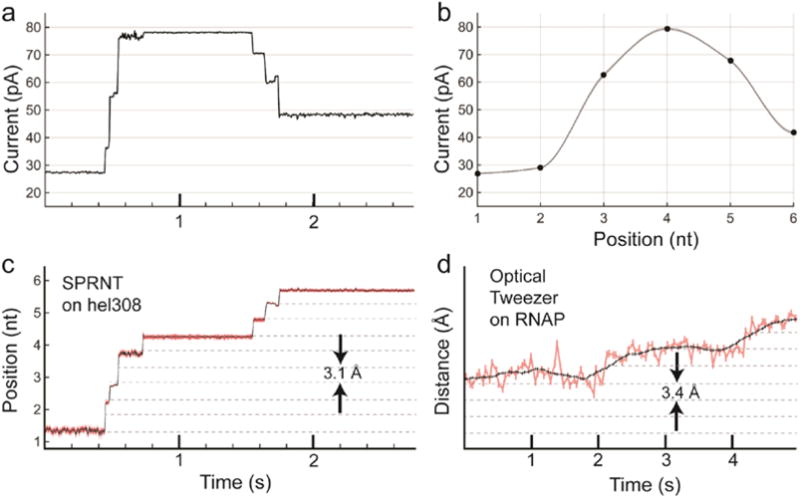
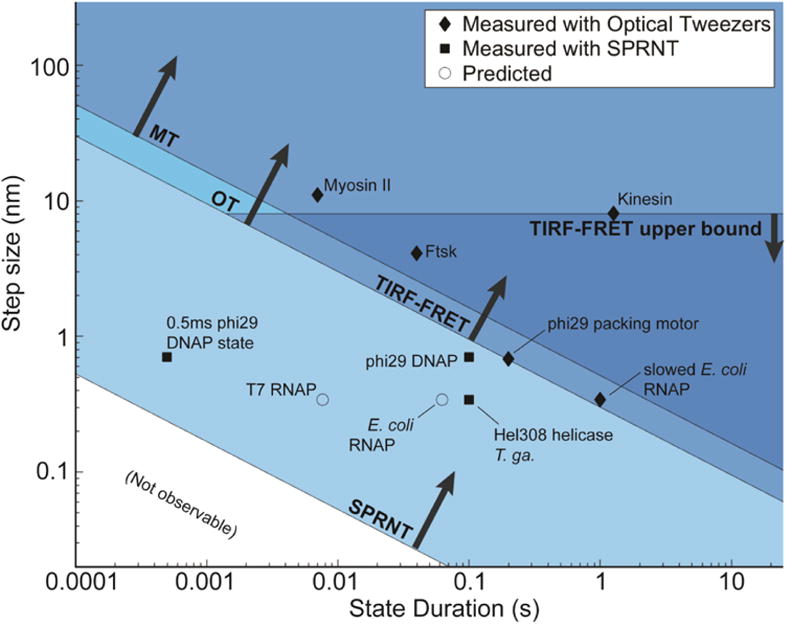
Nanopores are emerging as new single-molecule tools in the study of enzymes. Based on the progress in nanopore sequencing of DNA, a tool called Single-molecule Picometer Resolution Nanopore Tweezers (SPRNT) was developed to measure the movement of enzymes along DNA in real time. In this new method, an enzyme is loaded onto a DNA (or RNA) molecule. A single-stranded DNA end of this complex is drawn into a nanopore by an electrostatic potential that is applied across the pore. The single-stranded DNA passes through the pore's constriction until the enzyme comes into contact with the pore. Further progression of the DNA through the pore is then controlled by the enzyme. An ion current that flows through the pore's constriction is modulated by the DNA in the constriction. Analysis of ion current changes reveals the advance of the DNA with high spatiotemporal precision, thereby providing a real-time record of the enzyme's activity. Using an engineered version of the protein nanopore MspA, SPRNT has spatial resolution as small as 40pm at millisecond timescales, while simultaneously providing the DNA's sequence within the enzyme. In this chapter, SPRNT is introduced and its extraordinary potential is exemplified using the helicase Hel308. Two distinct substates are observed for each one-nucleotide advance; one of these about half-nucleotide long steps is ATP dependent and the other is ATP independent. The spatiotemporal resolution of this low-cost single-molecule technique lifts the study of enzymes to a new level of precision, enabling exploration of hitherto unobservable enzyme dynamics in real time.

Keywords: DNA sequencing; Enzyme kinetics; Force spectroscopy; High spatiotemporal resolution; In vitro; MspA; Single molecule; Single-nucleotide resolution.


Figures

Figure 1
Figure 1. The nanopore system with a biological pore
A phospholipid lipid bilayer (purple/grey) spans a Teflon (light blue) aperture, separating a KCl solution into two compartments, cis and trans. A single αHL nanopore (gold) is inserted into the bilayer. A voltage is applied via two Ag/AgCl electrodes and the resulting ion current through the pore is measured. The polynegatively charged DNA is attracted to the pore and moves through the pore. While the DNA moves through the pore it reduces the ion current. Modified from (A. H. Laszlo, Derrington, & Gundlach, 2016).
Figure 2
Figure 2. Mycobacterium smegmatis porin A (MspA)
Wild type MspA contains negatively charged residues D90, D91, and D93. Butler et al. found that mutation of these residues to neutrally charged N allowed DNA to translocate through the MspA pore. Further mutation of the pore to include positively charged residues within the vestibule (D118R, D134R, and E139K) resulted in increased DNA interaction as the negatively charged DNA was attracted into the pore by the positive residues. Modified from (Butler et al., 2008).
Figure 3
Figure 3. Phi29 DNAP controls DNA translocation via the blocking oligomer technique
a) In bulk, phi29 DNAP loads onto the target DNA but is prevented from making double- stranded DNA by an unextendable oligomer (i). The single-stranded 5′-end inserts into the pore until the DNAP come to rest on the top of the pore. The electric force on the DNA pulls it through the phi29 DNAP unzipping the frayed end of the duplex DNA like a zipper (ii). The DNA moves nucleotide by nucleotide toward trans. Once the blocking oligomer is unzipped and dissociated (iii), the DNAP encounters the extendable end of the primer, which can be formed by a hairpinned 3′-end of the template strand. If proper buffer conditions are present, the phi29 DNAP begins extending the primer, thereby pulling the template strand back out of the pore from trans to cis. b) As phi29 DNAP steps DNA through the pore, a series of current levels are observed. Green and blue arrows indicate the current levels that correspond to unzipping and polymerase mode, respectively. Regions of the current trace that contain backsteps are indicated with a ‘*’. c) Because the durations of the observed current levels have stochastic durations, we depict observed current level amplitudes without duration information to form a “level plot.” Here we show a level plot of 20 separate single-molecule reads of identical DNA strands. The level plot displays a symmetry about the change-over from unzipping mode to polymerase mode. Each nucleotide sequence of the DNA can be associated with the current levels. In some places, adjacent levels are indistinguishable, thus we observe slightly fewer levels than there are DNA bases within the sequence. To compensate for well evaporation and electrode offsets a linear scale and offset is applied to the measured current values. Modified from (Manrao et al., 2012).
Figure 4
Figure 4. Transduction of current to distance
a) Regions of high current contrast can be used to measure DNA position precisely. This shows how small uncertainties in measured current translate to small positional uncertainty. b) Schematic depiction of DNA position within the pore at two different voltages; differences in the applied electric force result in different DNA extensions. c) Current levels observed for phi29 DNAP controlled motion of DNA through MspA at 180 mV and 140 mV of applied potential. A cubic spline interpolant has been applied to each set of current steps. Note that, apart from a scaling factor, the shape of the spline is identical but the peak of the spline has shifted a distance δ. d) after a linear scale and offset is applied to the two splines a horizontal displacement δ = 0.29 nt brings the two splines in line with one another. This experiment has two important results: 1) The current levels observed during single-nucleotide stepping of DNA through MspA lie along an underlying smooth curve that is well-approximated by a spline. 2) This spline provides a direct mapping from current to DNA position and we can use it to measure sub-nucleotide movement of DNA. Figure modified from (Derrington et al., 2015).
Figure 5
Figure 5. Sub-nucleotide steps in helicase movement
a) Levels observed when stepping the indicated DNA strand through MspA with phi29 DNAP controlling the DNA motion and b) with helicase T. gammatolerans Hel308 controlling the DNA motion. The observed current patterns are similar; however the helicase takes twice as many steps. c) Comparison of the half-lives of each level at two different concentrations of ATP. d) Ratio of observed half-lives from c). Interestingly, the duration of odd-numbered levels (orange diamonds) varies as [ATP] changes, while even-numbered levels (blue diamonds) remain unchanged. With the ability to resolve such small substates and observe their chemical dependencies, SPRNT has the potential to shed light on how such motors actually do their work. Modified from (Derrington et al., 2015).
Figure 6
Figure 6. ATP dependence of Hel308 sub-nucleotide steps
a) The half-lives for the ATP- dependent step, averaged over all ATP-dependent levels (gold) and the ATP-independent step, averaged over all ATP-independent levels (blue) as a function of 1/[ATP], with best fit lines drawn as dashed lines over both. The inset shows the inverse plot of rate (rate = ln(2) / τ1/2) vs. [ATP]. b) Temperature dependence of the ATP-dependent (gold) and ATP- independent (blue) steps and resulting linear fit assuming Arrhenius kinetics. Panel a) modified from (Derrington et al., 2015).
Figure 7
Figure 7. Close-up view of an example Hel308-controlled current transition
The observed step is a transition of the ATP independent state going into the ATP dependent state and therefore represents the motion of the DNA through the pore by just 0.45 ±0.04 nt. This data was acquired at a sampling frequency of 50 kHz (10 kHz Bessel filtered). The exquisite signal to noise ratio available in SPRNT enables resolution of enzymatic states as short as 200 μs with precision in the timing of such transitions to within 40 μs.
Figure 8
Figure 8. Conversion of current trace to DNA displacement and comparison to OT
a) Raw current trace from SPRNT measurement of Hel308 helicase median filtered at 200 Hz (5 ms). b) A piecewise cubic hermite interpolating polynomial (PCHIP) interpolation of current values observed for translocation of the same DNA through an MspA pore using phi29 DNAP. c) The interpolation in b) is used to translate the currents observed in a) to DNA position. Note that the relatively uniform noise seen in the current trace is either enhanced or suppressed due to the slope of the interpolant. Regions of high slope yield precise measurements of position on short time-scales while regions of low slope yield less precise position measurements. Nanopore data is displayed at 200 Hz. d) Example OT data of single nucleotide RNAP steps from Abbondanzieri, et al. (Abbondanzieri et al., 2005) for comparison. Note, OT data in pink is filtered at 20 Hz (50 ms window) and the black is filtered at 1.33 Hz (750 ms window), while the black trace in the nanopore data is median filtered at 200 Hz (5 ms window). Figure originally appeared in (A. H. Laszlo et al., 2016).
Figure 9
Figure 9
Spatiotemporal resolution of SPRNT (Derrington et al., 2015) as compared to OT (Abbondanzieri et al., 2005; Moffitt et al., 2006; Moffitt et al., 2008), MT (Dulin et al., 2015), and TIRF-FRET (Holden et al., 2010). Many nucleic acid processing enzymes work on time- scales and step sizes that are too fast and too small to be resolved with current techniques. The spatiotemporal resolution provided by SPRNT may enable study of previously unobservable kinetic steps. SPRNT has already shown its ability to measure sub-nucleotide steps on time scales that exceed the spatiotemporal resolution of OT. To provide context, black diamonds indicate average step-sizes and durations for various enzyme steps observed with OT (Abbondanzieri et al., 2005; Finer, Simmons, & Spudich, 1994; Moffitt et al., 2009; Moffitt et al., 2008; Saleh, Perals, Barre, & Allemand, 2004; Svoboda, Schmidt, Schnapp, & Block, 1993), black squares indicate enzymes measured with SPRNT (Derrington et al., 2015; Manrao et al., 2012), while open circles represent estimated step-sizes and step durations for several other enzymes based on known stepping rates and suspected step size (Seidel & Dekker, 2007). While an average step may be resolvable with a given technique, it can be useful to have spatiotemporal resolution exceeding the average stepping rate of an enzyme so that the entire stepping distribution can be observed. The square labeled “0.5ms phi29 DNAP state” shows the position of a fast, yet resolved single-step measurement (Derrington et al., 2015) that falls far closer to the noise limit than the average observed step duration. Figure originally appeared in (A. H. Laszlo et al., 2016).

References

    1. Abbondanzieri EA, Greenleaf WJ, Shaevitz JW, Landick R, Block SM. Direct observation of base-pair stepping by RNA polymerase. Nature. 2005;438(7067):460–465. doi: 10.1038/nature04268. - DOI - PMC - PubMed
    1. Adam G, Delbruck M. Reduction of dimensionality in biological diffusion processes. San Francisco: W.H: Freeman & Co; 1968.
    1. Adelman K, La Porta A, Santangelo TJ, Lis JT, Roberts JW, Wang MD. Single molecule analysis of RNA polymerase elongation reveals uniform kinetic behavior. Proceedings of the National Academy of Sciences of the United States of America. 2002;99(21):13538–13543. doi: 10.1073/pnas.212358999. - DOI - PMC - PubMed
    1. Akeson M, Branton D, Kasianowicz JJ, Brandin E, Deamer DW. Microsecond time-scale discrimination among polycytidylic acid, polyadenylic acid, and polyuridylic acid as homopolymers or as segments within single RNA molecules. Biophysical Journal. 1999;77(6):3227–3233. - PMC - PubMed
    1. Bosco A, Camunas-Soler J, Ritort F. Elastic properties and secondary structure formation of single-stranded DNA at monovalent and divalent salt conditions. Nucleic Acids Research. 2013 doi: 10.1093/nar/gkt1089. - DOI - PMC - PubMed

Publication types

MeSH terms

LinkOut - more resources