. 2017 Feb 1;68(5):1169-1183.
doi: 10.1093/jxb/erw485.

Protein phosphatase AP2C1 negatively regulates basal resistance and defense responses to Pseudomonas syringae

Affiliations

Protein phosphatase AP2C1 negatively regulates basal resistance and defense responses to Pseudomonas syringae

Volodymyr Shubchynskyy et al. J Exp Bot. .

Abstract

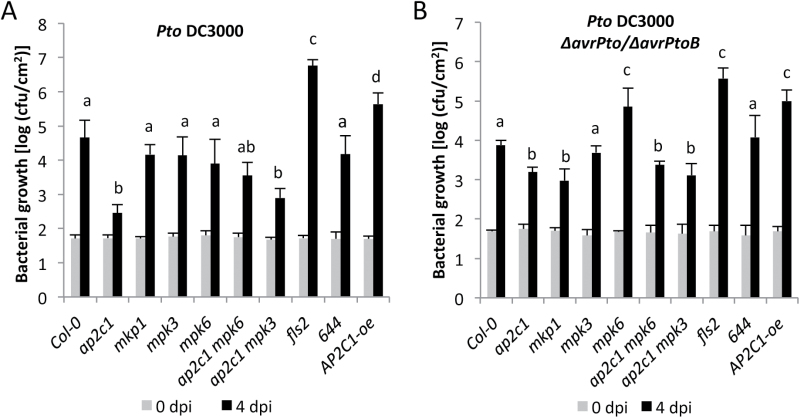
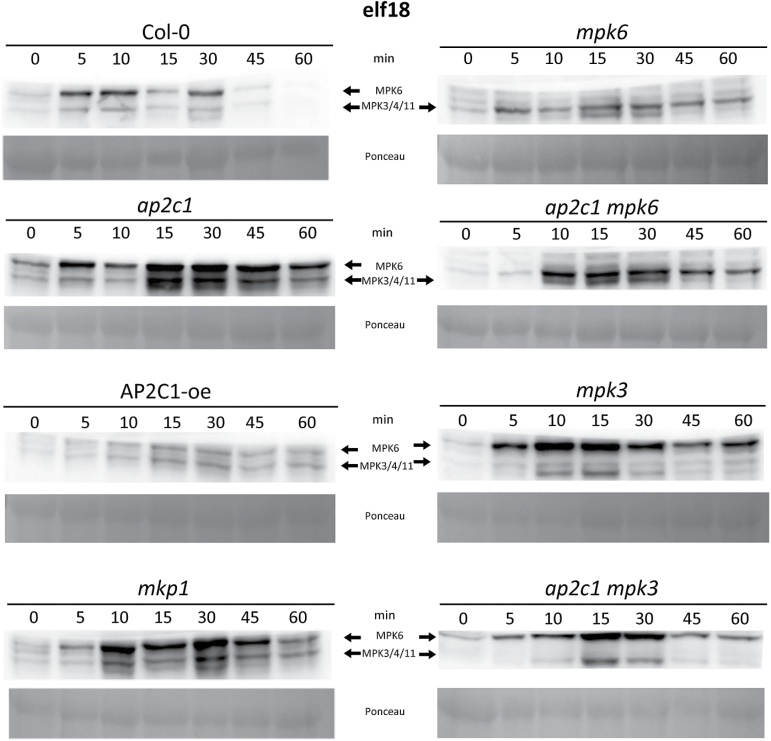
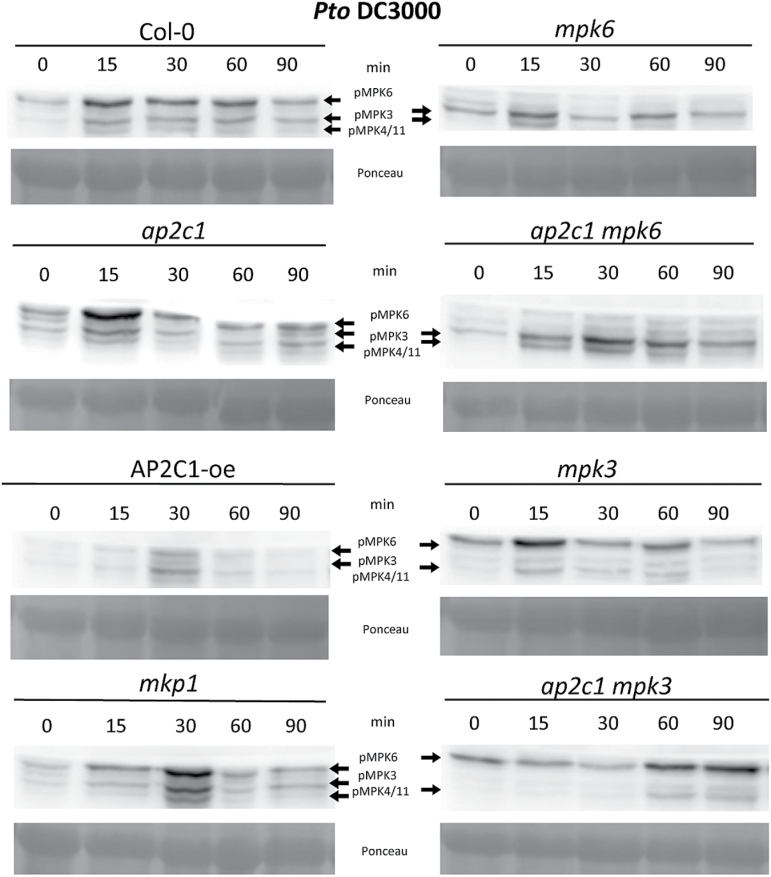
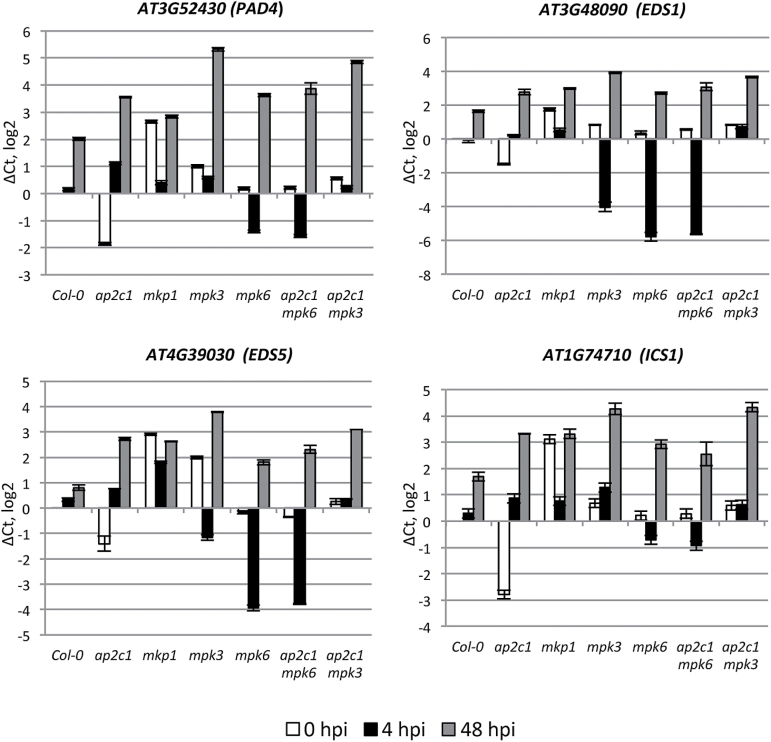
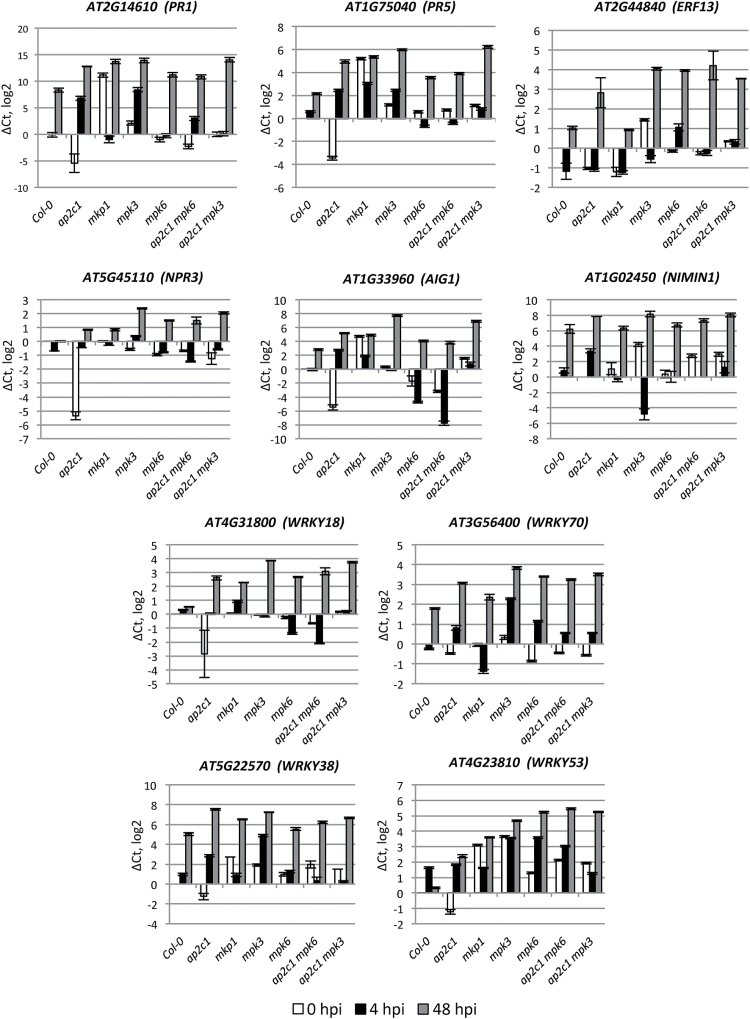
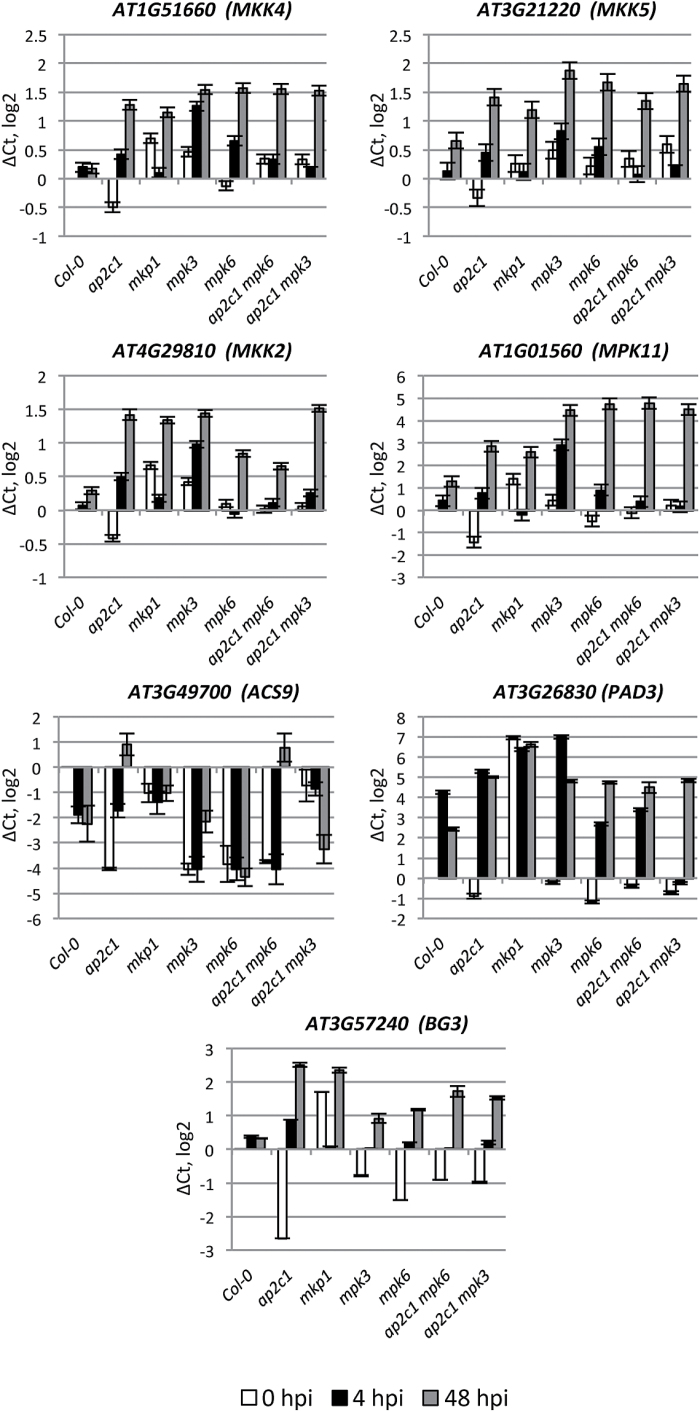
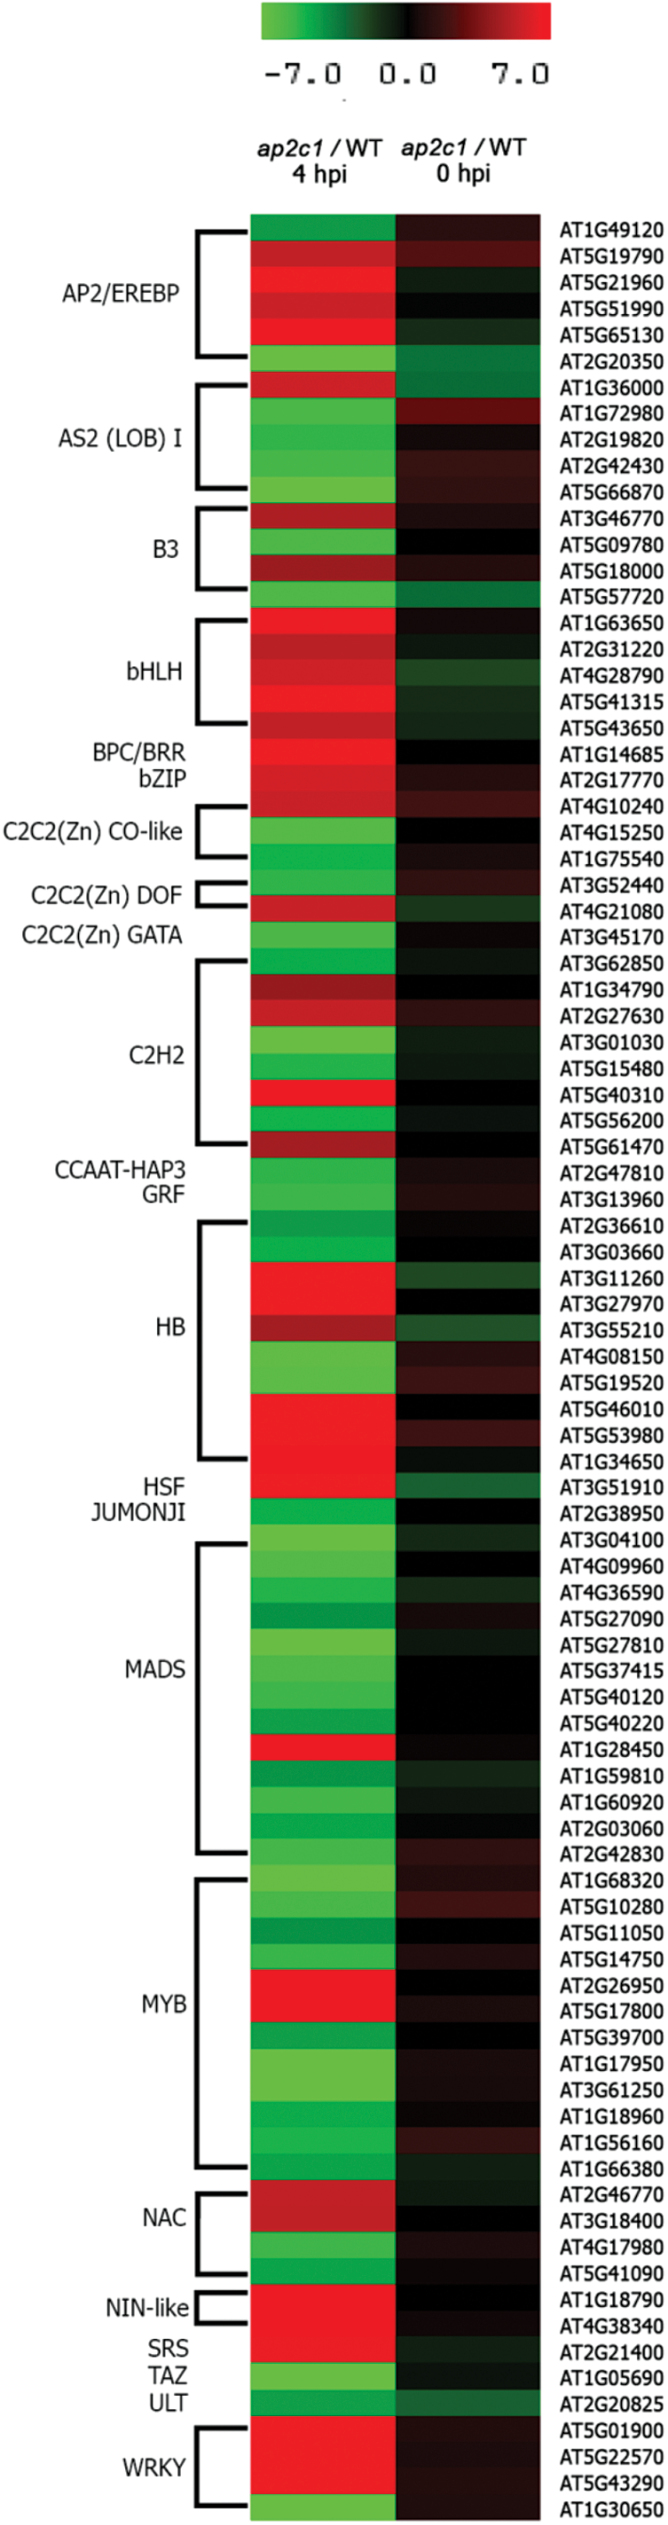
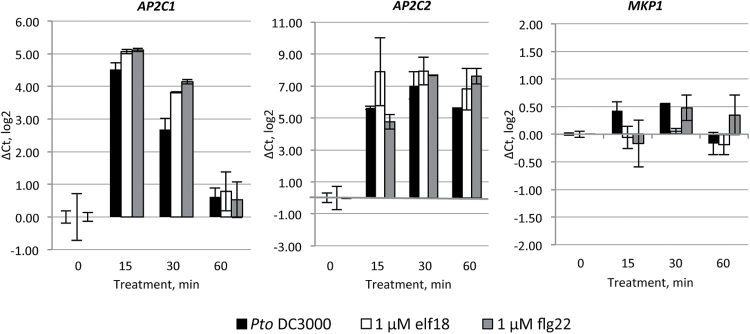
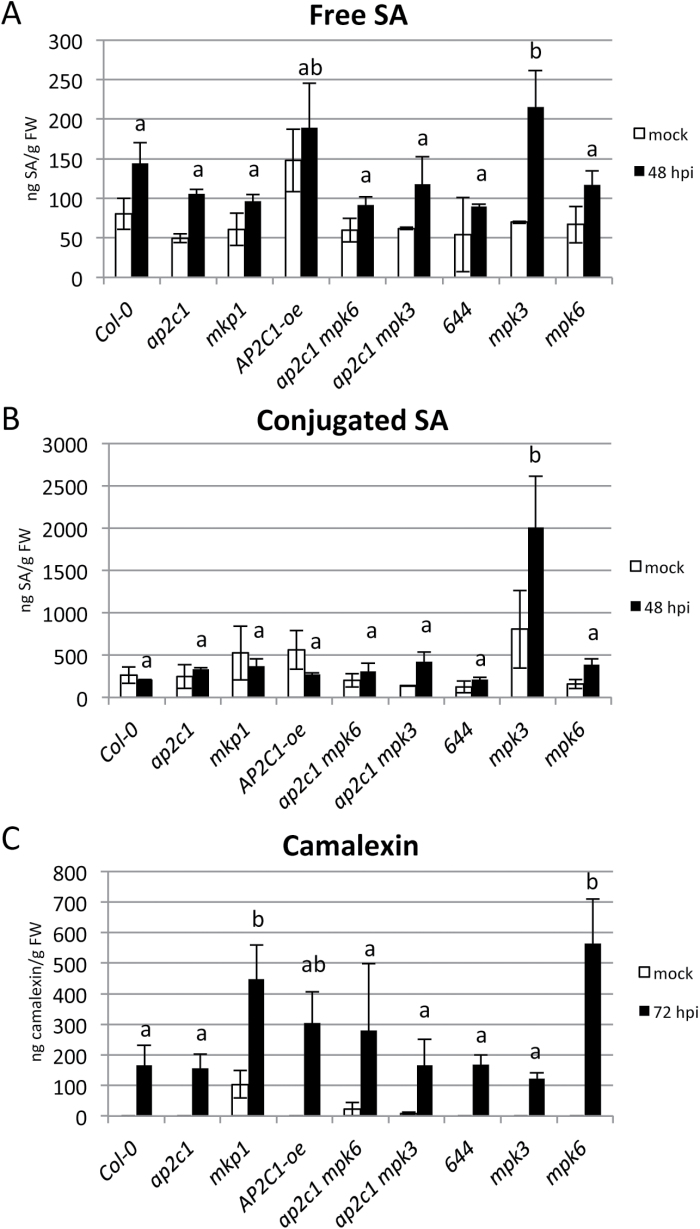
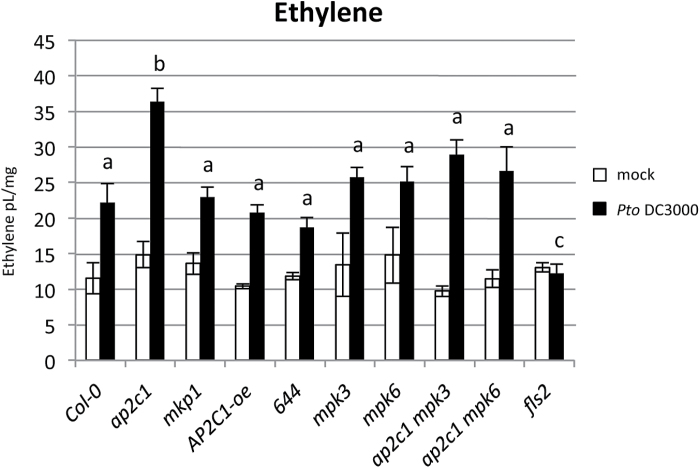
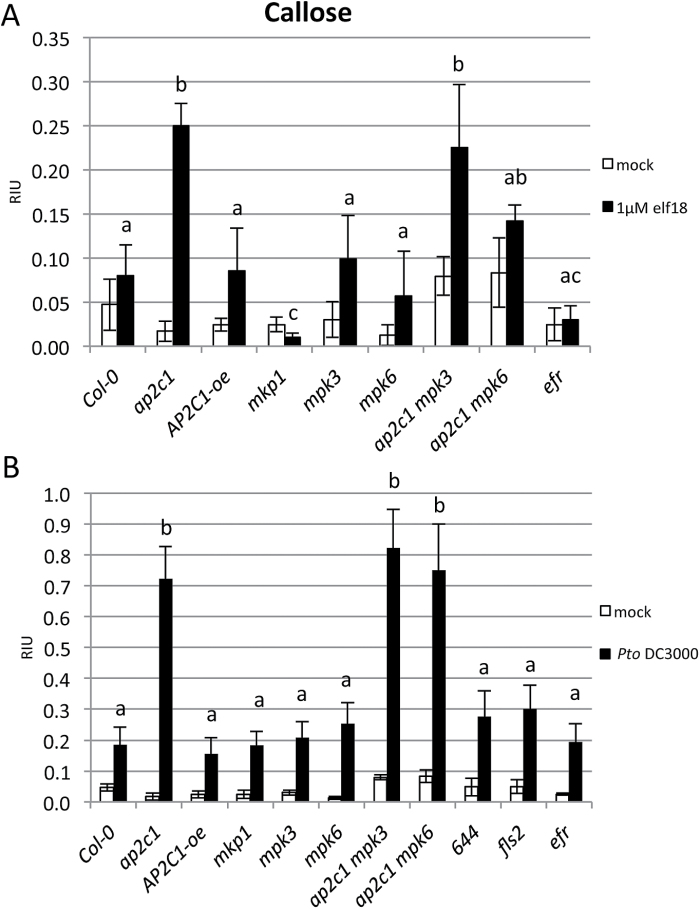
Mitogen-activated protein kinases (MAPKs) mediate plant immune responses to pathogenic bacteria. However, less is known about the cell autonomous negative regulatory mechanism controlling basal plant immunity. We report the biological role of Arabidopsis thaliana MAPK phosphatase AP2C1 as a negative regulator of plant basal resistance and defense responses to Pseudomonas syringae. AP2C2, a closely related MAPK phosphatase, also negatively controls plant resistance. Loss of AP2C1 leads to enhanced pathogen-induced MAPK activities, increased callose deposition in response to pathogen-associated molecular patterns or to P. syringae pv. tomato (Pto) DC3000, and enhanced resistance to bacterial infection with Pto. We also reveal the impact of AP2C1 on the global transcriptional reprogramming of transcription factors during Pto infection. Importantly, ap2c1 plants show salicylic acid-independent transcriptional reprogramming of several defense genes and enhanced ethylene production in response to Pto. This study pinpoints the specificity of MAPK regulation by the different MAPK phosphatases AP2C1 and MKP1, which control the same MAPK substrates, nevertheless leading to different downstream events. We suggest that precise and specific control of defined MAPKs by MAPK phosphatases during plant challenge with pathogenic bacteria can strongly influence plant resistance.

Keywords: Callose; MAPK; MAPK phosphatase; PAMP; PP2C phosphatase; Pseudomonas syringae; defense genes; salicylic acid; transcription factors..


Figures

Fig. 1.
Fig. 1.
Susceptibility of plants to the pathogen P. syringae. Four-week-old plants were spray-infected with P. syringae pv. tomato (Pto) DC3000 (A) or Pto DC3000 ΔavrPto/ΔavrPtoB (B) and bacterial count measured at 4 days post-infection (dpi). Values shown are means±standard deviation (n=8) of one representative experiment from three independent repetitions. One-way ANOVA/Holm–Sidak: ab, P<0.01; ac, P<0.01; ad, P<0.01.
Fig. 2.
Fig. 2.
AP2C1 controls elf18-induced MAPK activation. Western blotting with p44/42 antibodies after application of 1 µM elf18 on seedlings. Profiling of MAPK activation by an immunological assay that detects phosphorylation of the MAPKs. MPK6 and MPK3/4/11 corresponding immunoreactive bands are indicated by arrows in the top panels. Ponceau staining was used to estimate equal loading (bottom panels).
Fig. 3.
Fig. 3.
Analysis of MAPK activation in response to infection with Pto DC3000. Western blotting with anti-p44/42 antibodies. Bacteria induced activation of MAPKs in plants after treatment with Pto DC3000; OD600=0.02. The immunoreactive protein bands corresponding to respective MAPKs are indicated in the top panels. Ponceau staining was used to estimate equal loading (bottom panels).
Fig. 4.
Fig. 4.
qRT-PCR analysis of SA-related gene expression. Adult 4-week-old plants were sprayed with Pto DC3000 or water as a mock control and harvested at 0 h (white bars), 4 h (black bars) and 48 h (2 dpi; gray bars) post-infection. The relative gene expression was normalized to the reference gene, ACTIN2. Results are from three biological and two technical replicates for each experiment. Error bars indicate SE. Values on the Y-axis are given on a log2 scale.
Fig. 5.
Fig. 5.
qRT-PCR analysis of defense-related gene expression. Adult 4-week-old plants were sprayed with Pto DC3000 or water as a mock control and harvested at 0 h (white bars), 4 h (black bars), and 48 h (2 dpi; gray bars) post-infection. The relative gene expression was normalized to the reference gene, ACTIN2. Results are mean of three biological and two technical replicates for each experiment. Error bars indicate SE. Values on the Y-axis are given on a log2 scale.
Fig. 6.
Fig. 6.
qRT-PCR analysis of pathogen-related gene expression (MAPK cascade components; ET-, camalexin- and callose-related genes). Adult 4-week-old plants were sprayed with Pto DC3000 or water as a mock control and harvested at 0 h (white bars), 4 h (black bars), and 48 h (gray bars) post-infection. The relative gene expression was normalized to the reference gene, ACTIN2. Results are mean of three biological and two technical replicates for each experiment. Error bars indicate SE. Values on the Y-axis are given on a log2 scale.
Fig. 7.
Fig. 7.
Heat map of 88 TF genes differentially regulated during Pto DC3000 immune response in ap2c1 compared with WT plants. Expression levels were determined in leaves of treated plants by multi-parallel qRT-PCR analysis. Red and green indicate higher and lower expression values, respectively. Intensity of the colors is proportional to the absolute value of log2 of the difference in gene expression between ap2c1 and WT. Black indicates no change in gene expression. Two biological replicates with two technical replicates in each were analysed.
Fig. 8.
Fig. 8.
Gene expression of AP2C1, AP2C2, and MKP1 after treatment with Pto DC3000, elf18 or flg22. Fourteen-day-old seedlings were treated with Pto DC3000, 1 µM elf18 or 1 µM flg22 and harvested at 0, 15, 30, and 60 min. The relative gene expression was normalized to the reference gene, ACTIN2. Results are mean of two biological and two technical replicates for each experiment. Error bars indicate SE. Values on the Y-axis are given on a log2 scale.
Fig. 9.
Fig. 9.
Analysis of SA and camalexin accumulation in plants treated with Pto DC3000. Levels of total free (A) and conjugated (B) SA, or total camalexin (C) as determined by HPLC in leaves of 4-week-old soil-grown plants mock spayed or treated with Pto DC3000 (OD600=0.02). (Results shown are mean±SE; n=4). One-way ANOVA/Holm–Sidak: ab, P<0.05.
Fig. 10.
Fig. 10.
Pto DC3000-induced ethylene production in seedlings. Two-week-old seedlings of Col-0 and corresponding mutant lines were treated with Pto DC3000 (OD600=0.02) and total amount of ethylene produced by treated plants in 24 h was measured. (Results shown are mean±SE; n=6). One-way ANOVA/Holm–Sidak between treated line samples: ab, P<0.05; ac, P<0.02.
Fig. 11.
Fig. 11.
Callose deposition in cotyledons in response to elf18 or Pto DC3000. Ten-day-old seedlings were treated for 24 h with 1 µM elf18 (A) or Pto DC3000 (OD=0.02) (B). Photographs of aniline blue-stained cotyledons under UV epifluorescence were quantified with ImageJ. Data shown are mean values±SE (n>10) of relative callose intensities (RIU, relative intensity units) as measured at 24 h after pathogen or PAMP treatment. One-way ANOVA/Holm–Sidak between treated lines samples: ab, P<0.03; ac, P<0.05.

References

    1. Anderson JC, Bartels S, González Besteiro MA, Shahollari B, Ulm R, Peck SC. 2011. Arabidopsis MAP Kinase Phosphatase 1 (AtMKP1) negatively regulates MPK6-mediated PAMP responses and resistance against bacteria. The Plant Journal 67, 258–268. - PubMed
    1. Anderson JC, Wan Y, Kim YM, Pasa-Tolic L, Metz TO, Peck SC. 2014. Decreased abundance of type III secretion system-inducing signals in Arabidopsis mkp1 enhances resistance against Pseudomonas syringae. Proceedings of the National Academy of Sciences of the United States of America 111, 6846–6851. - PMC - PubMed
    1. Andreasson E, Ellis B. 2010. Convergence and specificity in the Arabidopsis MAPK nexus. Trends in Plant Science 15, 106–113. - PubMed
    1. Asai T, Tena G, Plotnikova J, Willmann MR, Chiu WL, Gomez-Gomez L, Boller T, Ausubel FM, Sheen J. 2002. MAP kinase signalling cascade in Arabidopsis innate immunity. Nature 415, 977–983. - PubMed
    1. Bartels S, Anderson JC, González Besteiro MA, Carreri A, Hirt H, Buchala A, Métraux JP, Peck SC, Ulm R. 2009. MAP kinase phosphatase1 and protein tyrosine phosphatase1 are repressors of salicylic acid synthesis and SNC1-mediated responses in Arabidopsis. The Plant Cell 21, 2884–2897. - PMC - PubMed

MeSH terms

Substances