. 2017 Apr 1;19(4):503-513.
doi: 10.1093/neuonc/now230.

Glioblastoma on a microfluidic chip: Generating pseudopalisades and enhancing aggressiveness through blood vessel obstruction events

Affiliations

Glioblastoma on a microfluidic chip: Generating pseudopalisades and enhancing aggressiveness through blood vessel obstruction events

Jose M Ayuso et al. Neuro Oncol. .

Abstract

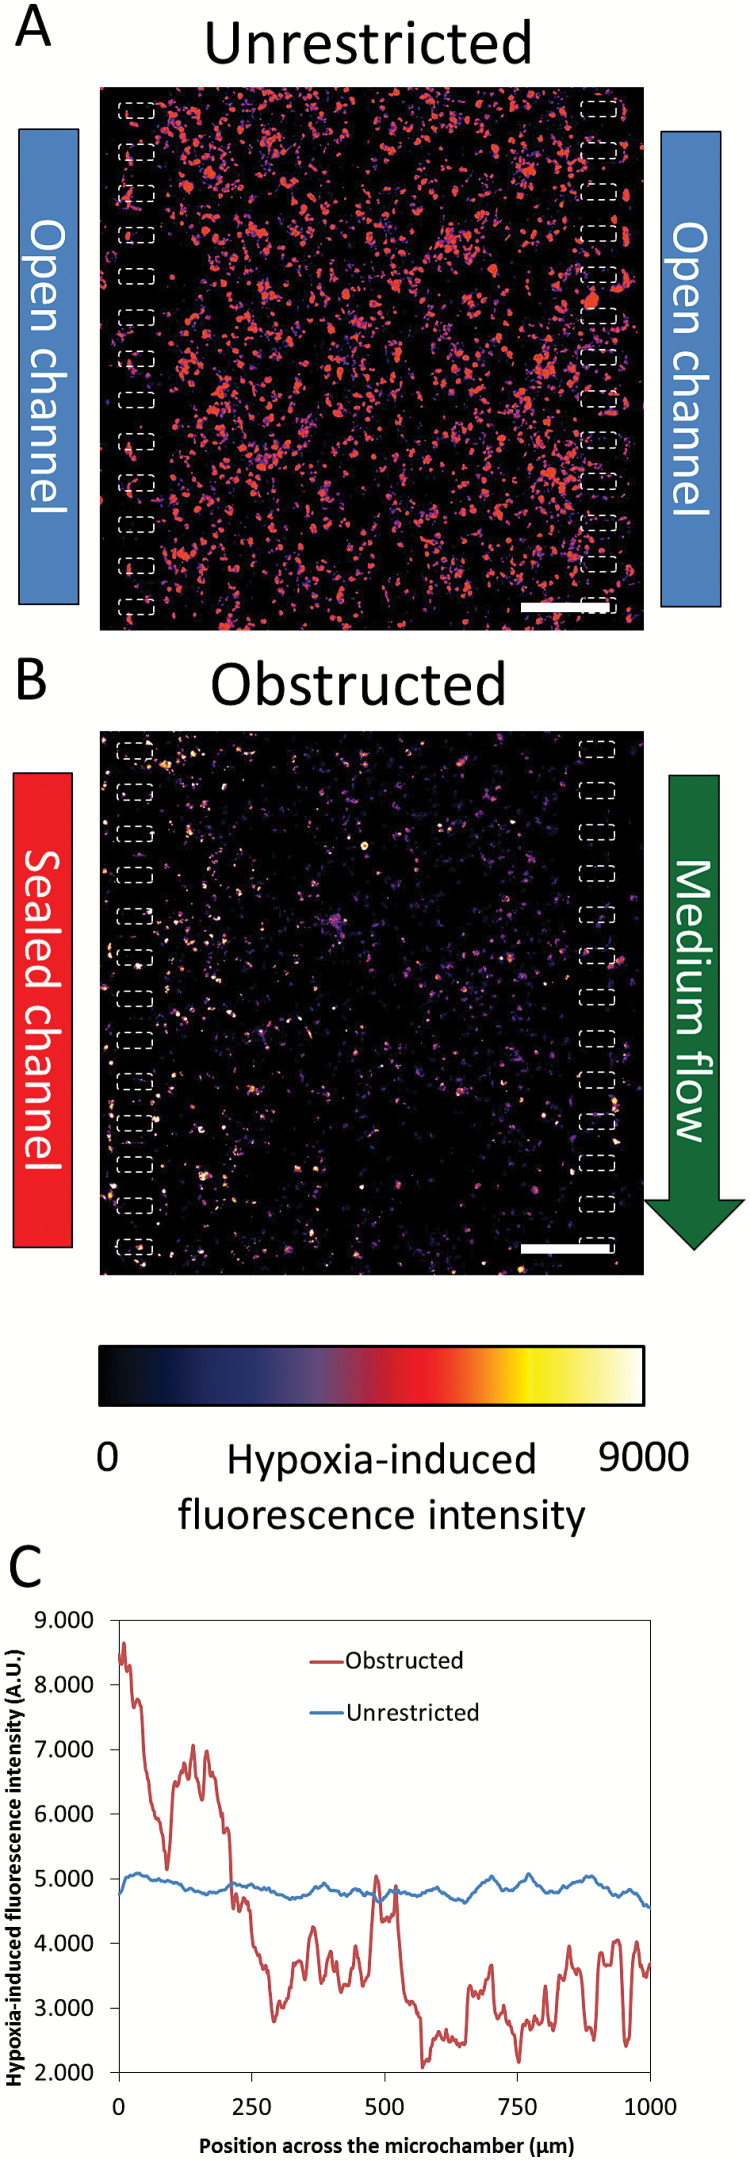
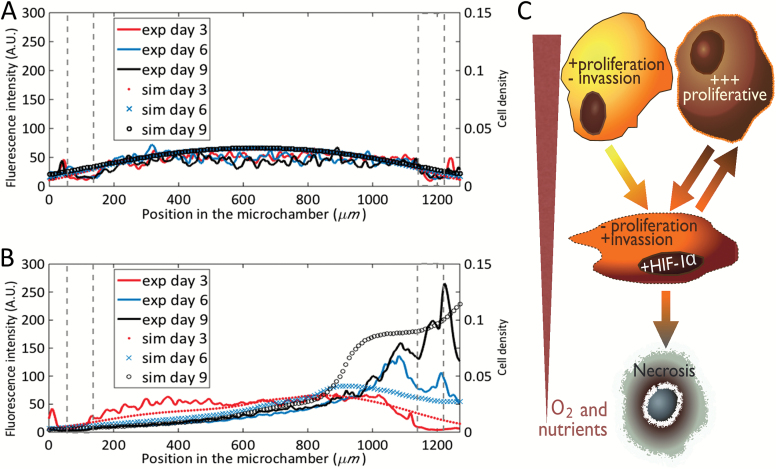
Background: Glioblastoma (GBM) is one of the most lethal tumor types. Hypercellular regions, named pseudopalisades, are characteristic in these tumors and have been hypothesized to be waves of migrating glioblastoma cells. These "waves" of cells are thought to be induced by oxygen and nutrient depletion caused by tumor-induced blood vessel occlusion. Although the universal presence of these structures in GBM tumors suggests that they may play an instrumental role in GBM's spread and invasion, the recreation of these structures in vitro has remained challenging.

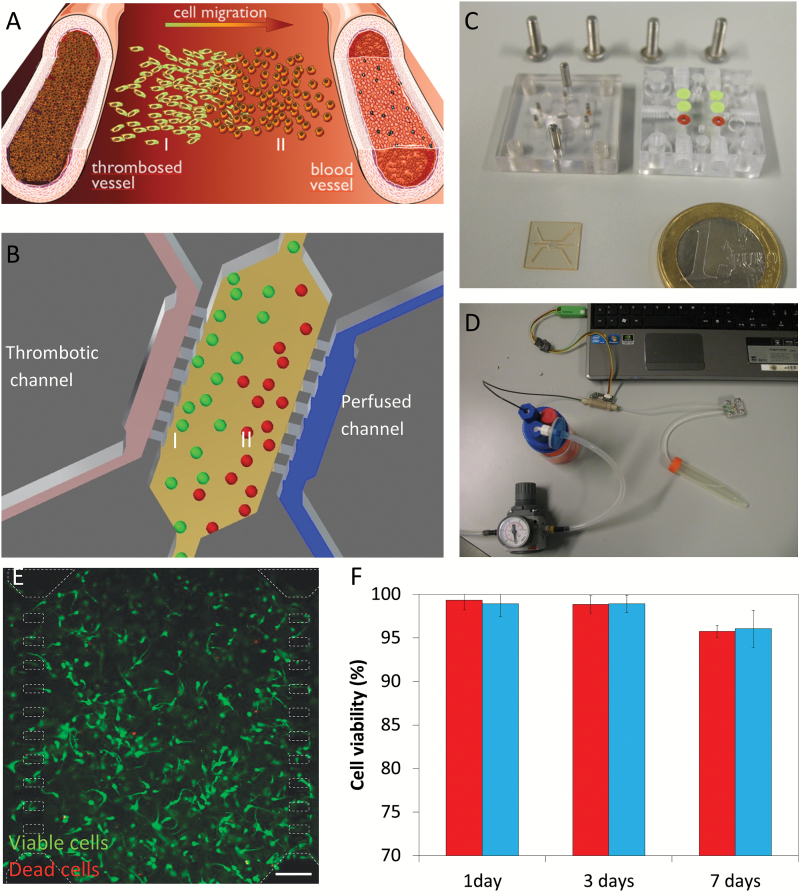
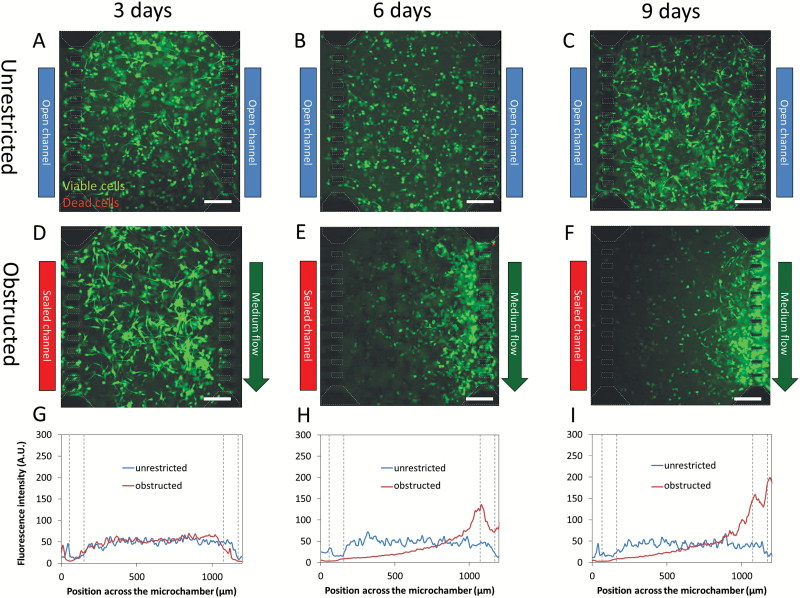
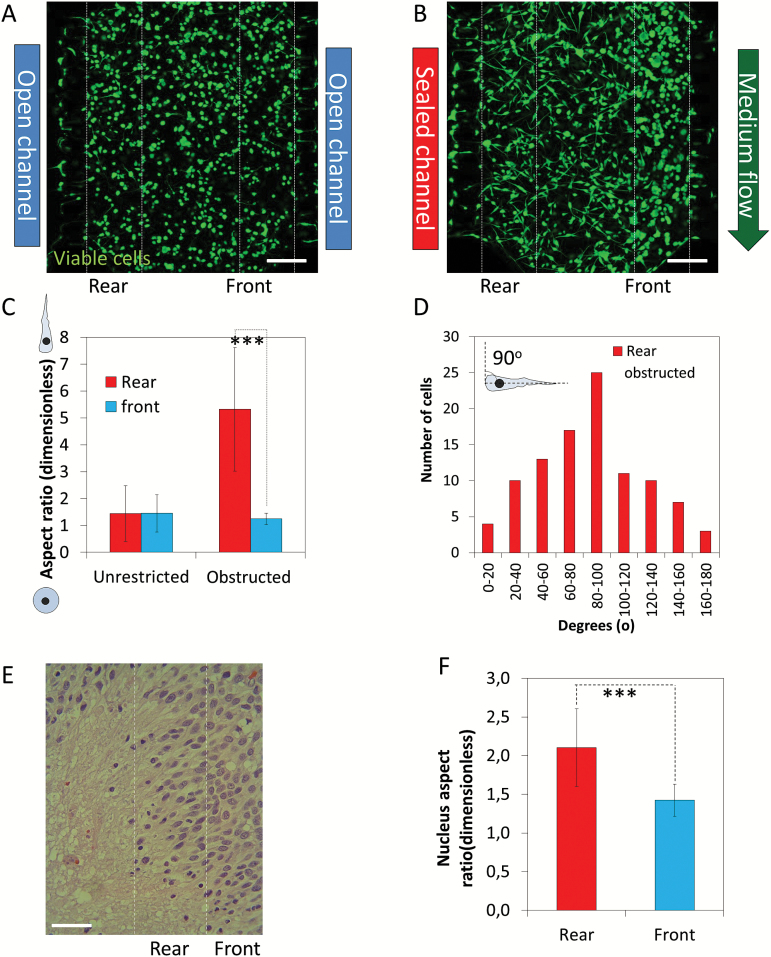
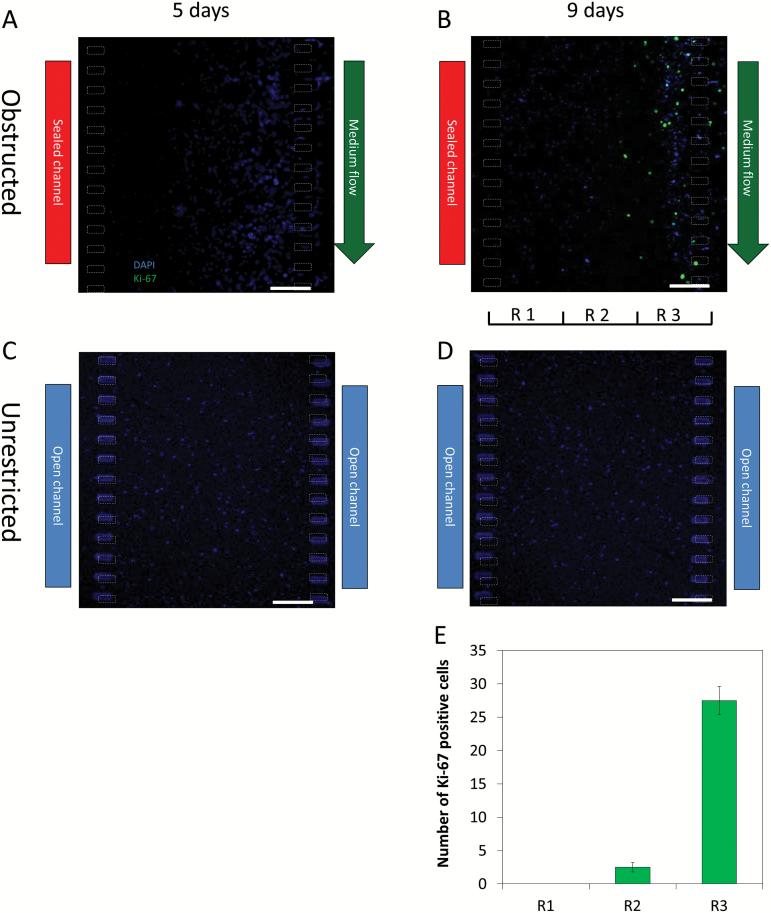
Methods: Here we present a new microfluidic model of GBM that mimics the dynamics of pseudopalisade formation. To do this, we embedded U-251 MG cells within a collagen hydrogel in a custom-designed microfluidic device. By controlling the medium flow through lateral microchannels, we can mimic and control blood-vessel obstruction events associated with this disease.

Results: Through the use of this new system, we show that nutrient and oxygen starvation triggers a strong migratory process leading to pseudopalisade generation in vitro. These results validate the hypothesis of pseudopalisade formation and show an excellent agreement with a systems-biology model based on a hypoxia-driven phenomenon.

Conclusions: This paper shows the potential of microfluidic devices as advanced artificial systems capable of modeling in vivo nutrient and oxygen gradients during tumor evolution.

Keywords: SU-8; glioblastoma; microfluidics; migration; pseudopalisades.


Figures

Fig. 1
Fig. 1
Experimental setup. (A) Scheme of pseudopalisade formation. Under obstructed conditions, nutrient scarcity triggers a migratory response in those cells located in the obstructed blood vessel vicinity (I) towards enriched regions (II). (B) Experimental scheme within the microdevice mimicking the obstructed conditions and the starved (I) and enriched (II) regions. (C) Fabricated microdevice and packaging tool. (D) Microfluidic system. (E) U-251 cell viability within the microdevice after 9 days, live cells (labeled with calcein 1 µg/ml) are shown in green, whereas dead cells are shown in red (labeled with propidium iodide 4 µg/ml). Microdevice posts (50x100 µm) are delimited in white dashed line. Cells were cultured at 4 million cells/ml within a 1.5 mg/ml collagen hydrogel. Viable cells are shown in green, whereas dead cells are shown in red. (F) Comparison of cell viability between hydrogels on Petri dishes (red) and within the microdevice (blue). Cell viability is expressed as the percentage of live cells. Scale bar is 200 µm.
Fig. 2
Fig. 2
Pseudopalisade formation under obstructed conditions. U-251 at 4 million cells/ml in collagen hydrogel at 1.5 mg/ml was cultured within microdevices. Under unrestricted conditions, medium was refreshed once a day, and cell viability was evaluated at 3 (A), 6 (B), and 9 (C) days using calcein (green) and propidium iodide (red). To mimic obstructed conditions, medium flow was enabled only through right microchannel, and cell viability was assessed at 3 (D), 6 (E), and 9 (F) days. Microdevice posts (50x100 µm) are delimited in white dashed line. Graphs show the fluorescence intensity across the microchamber orthogonal view at 3 (G), 6 (H), and 9 days (I) in obstructed as unrestricted conditions. Post position in the graphs is delimited by gray dashed lines. Scale bar is 200 µm.
Fig. 3
Fig. 3
Cell shape during pseudopalisade formation. Confocal images of the microchamber were taken after 5 days in culture under unrestricted (A) or obstructed conditions (B). (C) Cell shape at the pseudopalisade rear and front was analyzed and compared with the same region under unrestricted conditions; *** denotes a statistical difference (P value 1.4x10⁻³²). (D) Directionality at the pseudopalisade rear under obstructed conditions. (E) Hematoxylin and eosin staining of a paraffin-embedded GBM sample. (F) Nucleus aspect ratio in the pseudopalisade rear and front in patient samples; *** denotes a statistical difference (P value 3.7x10⁻⁸). Scale bar is 200 µm.
Fig. 4
Fig. 4
Proliferation during pseudopalisade formation. Ki-67 immunofluorescence was performed within the microdevices during the different steps of the pseudopalisade formation. (A–B) Under obstructed conditions, ki-67 positive cells were observed only after 9 days, when the pseudopalisade was completely formed. (C–D) Under unrestricted conditions, no positive cells were observed at 5 or 9 days. (ED) Quantitative analysis of Ki-67 positive cells in the three regions deffined in “B”. Scale bar is 200 µm.
Fig. 5
Fig. 5
Oxygen profile. Oxygen profile was detected after 5 days in culture using Image-it Hypoxia reagent. Images are shown as heat-map hypoxia-induced fluorescence intensity. Hypoxia-induced fluorescence intensity across the microchamber revealed that oxygen concentration was constant under unrestricted conditions (A), whereas an oxygen gradient was established under obstructed conditions (B). The graph shows the hypoxia-induced fluorescence intensity profile across the microchamber (C). Scale bar is 200 µm.
Fig. 6
Fig. 6
Computer simulations versus experimental data of the cell evolution profiles. Simulations of tumor cell density evolution and experimental data of fluorescence intensity within the chamber under unrestricted conditions (A) and under obstructed conditions (B). Left Y axis denotes fluorescence intensity from experiments at days 3, 6, and 9, curves red, blue, and black, respectively. Right Y axis denotes cell density from simulations at days 3, 6, and 9, red spots, blue cross, and black circles, respectively. Post position in the graphs is delimited by gray dashed line. (C) Graphical depiction of the mathematical model scheme based on previous models [10, 13] including 3 cancer cell phenotypes, the oxygenation and the necrosis (C).

References

    1. Oike T, Suzuki Y, Sugawara K, et al. Radiotherapy plus concomitant adjuvant temozolomide for glioblastoma: Japanese mono-institutional results. PLoS One. 2013;8(11):e78943. - PMC - PubMed
    1. Brat DJ, Kaur B, Van Meir EG. Genetic modulation of hypoxia induced gene expression and angiogenesis: relevance to brain tumors. Front Biosci. 2003;8:100–116. - PubMed
    1. Rong Y, Durden DL, Van Meir EG, Brat DJ. ‘Pseudopalisading’ necrosis in glioblastoma: a familiar morphologic feature that links vascular pathology, hypoxia, and angiogenesis. J Neuropathol Exp Neurol. 2006;65(6):529–539. - PubMed
    1. Brat DJ, Castellano-Sanchez AA, Hunter SB, et al. Pseudopalisades in glioblastoma are hypoxic, express extracellular matrix proteases, and are formed by an actively migrating cell population. Cancer Res. 2004;64(3):920–927. - PubMed
    1. Wippold FJ, 2nd, Lämmle M, Anatelli F, Lennerz J, Perry A. Neuropathology for the neuroradiologist: palisades and pseudopalisades. AJNR Am J Neuroradiol. 2006;27(10):2037–2041. - PMC - PubMed

MeSH terms