

doi: 10.1002/rcm.7823.
Interactive van Krevelen diagrams - Advanced visualisation of mass spectrometry data of complex mixtures
Affiliations
- PMID: 28063248
- PMCID: PMC5324645
- DOI: 10.1002/rcm.7823
Item in Clipboard
Interactive van Krevelen diagrams - Advanced visualisation of mass spectrometry data of complex mixtures
Rapid Commun Mass Spectrom.
.
No abstract available
Figures

Overview screenshot of the i‐van Krevelen Main Page. Four sub‐plots are shown, from top left clockwise, van Krevelen, centroid mass spectrum, DBE vs C #, and AI(mod) vs C #. The scatter plots have points sized per their relative abundance, while the colour scales represent either m/z range (van Krevelen) or oxygen number (DBE vs C# and AI(mod) vs C#). [Colour figure can be viewed at wileyonlinelibrary.com]
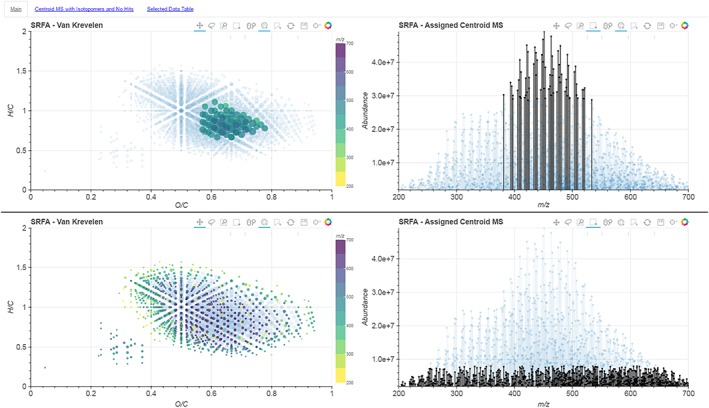
Screenshots of the van Krevelen and centroid mass spectrum plots with two different selections of data points. The top frame shows that the selection of the most abundant ions only represents a small range of chemical diversity on the van Krevelen plots, whilst the bottom frame shows that the least abundant ions, “the grass”, represent the true chemical diversity of the spectrum. [Colour figure can be viewed at wileyonlinelibrary.com]
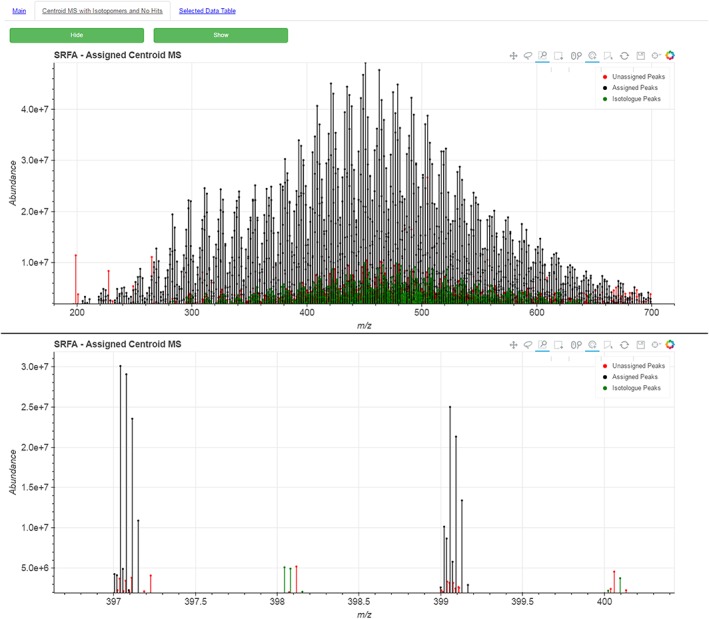
Screenshots of the centroid mass spectrum showing an overlay of peaks which represent isotopomers (green) and peaks which could not be assigned a molecular formula (red). The bottom frame shows a zoomed in region of m/z 397–400, clearly showing the monoisotopic peaks and their associated 13C isotopomers. Those peaks not assigned may be secondary isotope peaks, e.g. with two 13C atoms or a single 18O atom. [Colour figure can be viewed at wileyonlinelibrary.com]
References
-
- Van Krevelen D.. Graphical statistical method for the study of structure and reaction processes of coal. Fuel 1950, 29, 269.
-
- Kim S., Kramer R. W., Hatcher P. G.. Graphical method for analysis of ultrahigh‐resolution broadband mass spectra of natural organic matter, the Van Krevelen diagram. Anal. Chem. 2003, 75, 5336. - PubMed
-
- Wu Z., Rodgers R. P., Marshall A. G.. Two‐ and three‐dimensional van Krevelen diagrams: A graphical analysis complementary to the Kendrick mass plot for sorting elemental compositions of complex organic mixtures based on ultrahigh‐resolution broadband Fourier transform ion cyclotron resonance. Anal. Chem. 2004, 76, 2511. - PubMed
-
- Herzsprung P., von Tümpling W., Hertkorn N., Harir M., Büttner O., Bravidor J., Friese K., Schmitt‐Kopplin P.. Variations of DOM quality in inflows of a drinking water reservoir: Linking of van Krevelen diagrams with EEMF spectra by rank correlation. Environ. Sci. Technol. 2012, 46, 5511. - PubMed
Publication types
LinkOut - more resources
Full Text Sources
Other Literature Sources