. 2017 Apr;26(4):779-786.
doi: 10.1016/j.jstrokecerebrovasdis.2016.10.017. Epub 2017 Jan 4.

White Matter Hyperintensity Associations with Cerebral Blood Flow in Elderly Subjects Stratified by Cerebrovascular Risk

Affiliations

White Matter Hyperintensity Associations with Cerebral Blood Flow in Elderly Subjects Stratified by Cerebrovascular Risk

Ahmed A Bahrani et al. J Stroke Cerebrovasc Dis. 2017 Apr.

Abstract

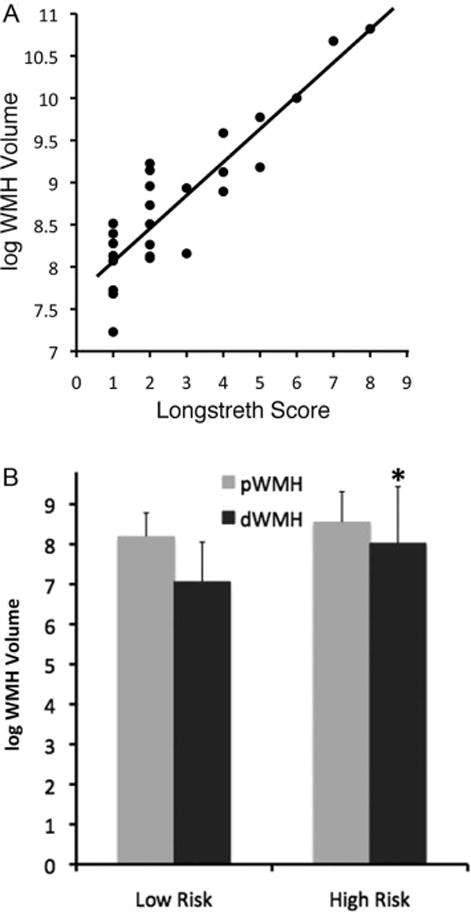
Objective: This study aims to add clarity to the relationship between deep and periventricular brain white matter hyperintensities (WMHs), cerebral blood flow (CBF), and cerebrovascular risk in older persons.

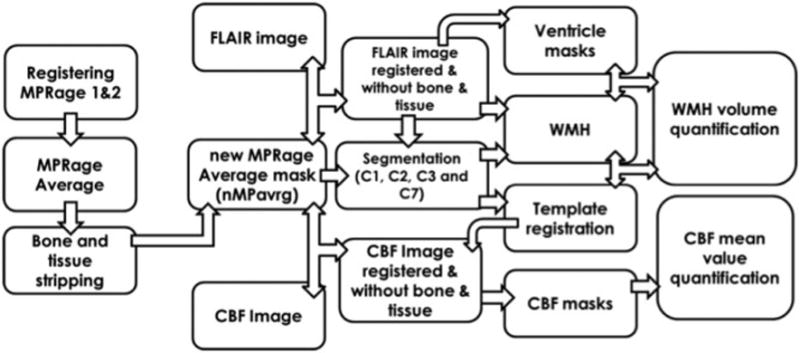
Methods: Deep white matter hyperintensity (dWMH) and periventricular white matter hyperintensity (pWMH) and regional gray matter (GM) and white matter (WM) blood flow from arterial spin labeling were quantified from magnetic resonance imaging scans of 26 cognitively normal elderly subjects stratified by cerebrovascular disease (CVD) risk. Fluid-attenuated inversion recovery images were acquired using a high-resolution 3-dimensional (3-D) sequence that reduced partial volume effects seen with slice-based techniques.

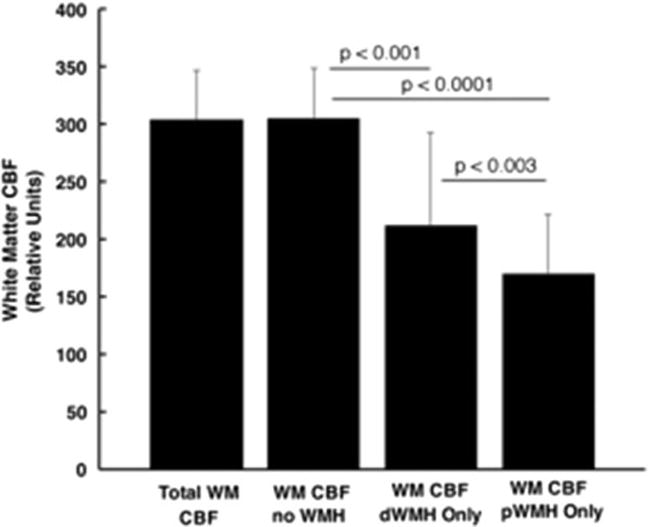
Results: dWMHs but not pWMHs were increased in patients at high risk of CVD; pWMHs but not dWMHs were associated with decreased regional cortical (GM) blood flow. We also found that blood flow in WM is decreased in regions of both pWMH and dWMH, with a greater degree of decrease in pWMH areas.

Conclusions: WMHs are usefully divided into dWMH and pWMH regions because they demonstrate differential effects. 3-D regional WMH volume is a potentially valuable marker for CVD based on associations with cortical CBF and WM CBF.

Keywords: White matter hyperintensities; arterial spin-labeling image; cerebral blood flow; fluid-attenuated inversion recovery; segmentation; small-vessel disease; vascular risk.


Figures

Figure 1
Figure 1
Diagrammatic overview of the processing workflow for quantitating WMH and CBF using, FLAIR and ASL images. Segments: C1: GM; C2: WM tissue class 1; C3: CSF; C7: WM tissue class 2.
Figure 2
Figure 2
A. Native-space GM segmented image. Panels B and C show ICBM template masks of WM and GM transferred to the standard space of the subject (compare with Panel A). Panel D shows the grey matter template masks applied to the registered ASL image.
Figure 3
Figure 3
Sequential steps of the segmentation process to quantitate WMH. A, B: segmented images representing two tissue classes of WM; C: total WM (A+B); D: WM mask from thresholding of D; E: FLAIR image; F: FLAIR image masked by D (FLAIR WM voxels); G: histogram of E showing Gaussian-fit and threshold of 3.0 S.D. (arowhead); H: WMH image obtained by applying threshold to F.
Figure 4
Figure 4
Sequential steps of obtaining deep WM and pre-ventricular WM binary masks. A – the CSF isolated from other tissue, panel B. C – identifying tissue. D – ventricular tissue voxels. E – reversing the intensity of (D) and multiply by FLAIR image, F, to remove the CSF, image G. H – is the edge of (D) that is dilated by 5×5×5 voxels, image I. (I and G) are multiplied to get the periventricular tissue, J, which is converted to binary image, K. L, WMH image, multiply by (K) once and the reverse intensity of (K) once to get pWMH and dWMH respectively images M and N.
Figure 5
Figure 5
(A) Linear regression of Longstreth visual rating scale (0–9) for all patients on log WMH total volume, demonstrating face validity of the WMH volume measurement (adjusted r2= 0.88, p<0.0001), (B) log WMH volume in low and high risk groups; overall volume is higher in high-risk patients (p=0.02), but only the dWMH volume is significant (p = 0.04; error bars = SD, asterisk *).
Figure 6
Figure 6
ASL blood flow in white matter in order left to right: total WM including WMH, total WM but excluding WMH, dWMH regions, and pWMH regions. Paired comparisons are significantly different as shown. Lowest CBF is in pWMH regions. Bar height: mean CBF; error bars: standard deviation.

References

    1. Go AS, Mozaffarian D, Roger VL, Benjamin EJ, Berry JD, Blaha MJ, et al. Heart disease and stroke statistics–2014 update: a report from the American Heart Association. Circulation. 2014;129:e28–e292. - PMC - PubMed
    1. Jellinger KA. The pathology of ischemic-vascular dementia: an update. Journal of the neurological sciences. 2002:203–204. 153–7. - PubMed
    1. Brickman AM, Zahra A, Muraskin J, Steffener J, Holland CM, Habeck C, et al. Reduction in cerebral blood flow in areas appearing as white matter hyperintensities on magnetic resonance imaging. Psychiatry research. 2009;172:117–20. - PMC - PubMed
    1. Bastos-Leite AJ, Kuijer JP, Rombouts SA, Sanz-Arigita E, van Straaten EC, Gouw AA, et al. Cerebral blood flow by using pulsed arterial spin-labeling in elderly subjects with white matter hyperintensities. AJNR American journal of neuroradiology. 2008;29:1296–301. - PMC - PubMed
    1. Gootjes L, Teipel SJ, Zebuhr Y, Schwarz R, Leinsinger G, Scheltens P, et al. Regional distribution of white matter hyperintensities in vascular dementia, Alzheimer's disease and healthy aging. Dementia and geriatric cognitive disorders. 2004;18:180–8. - PubMed