

Linking photosynthesis and leaf N allocation under future elevated CO2 and climate warming in Eucalyptus globulus
- PMID: 28064178
- PMCID: PMC5444472
- DOI: 10.1093/jxb/erw484
Linking photosynthesis and leaf N allocation under future elevated CO2 and climate warming in Eucalyptus globulus
Abstract
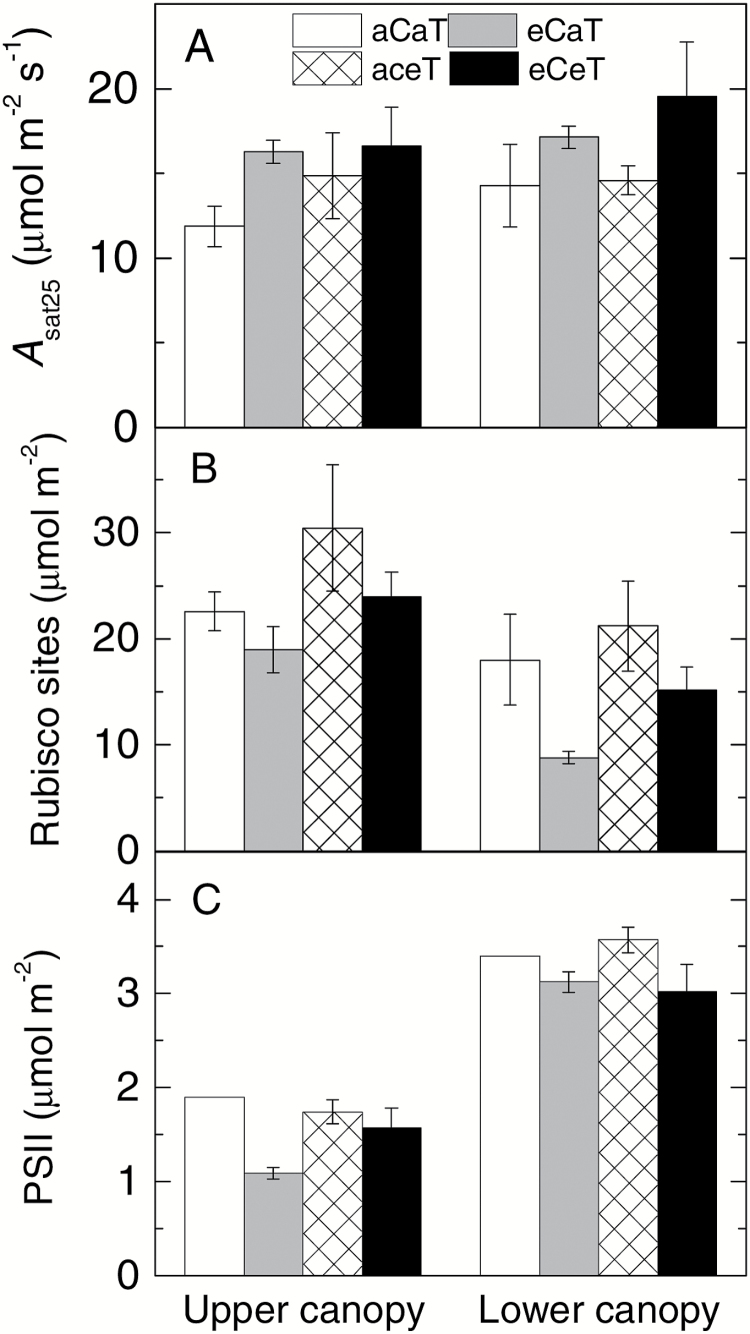
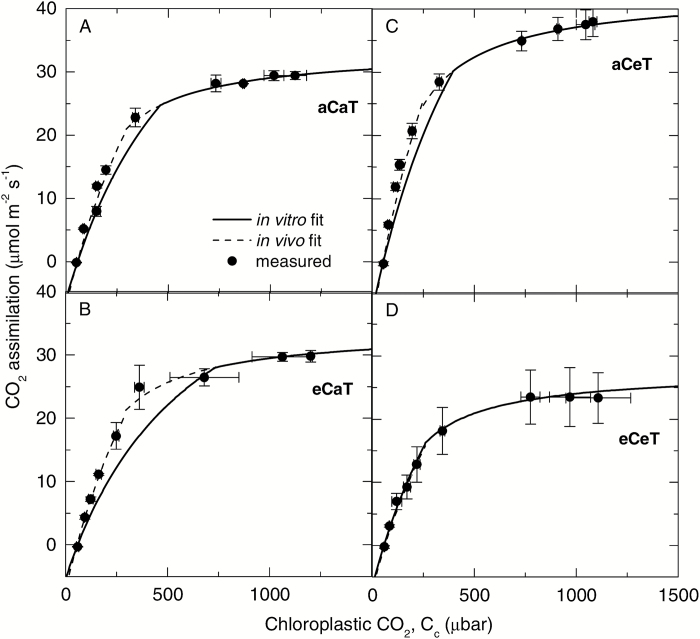
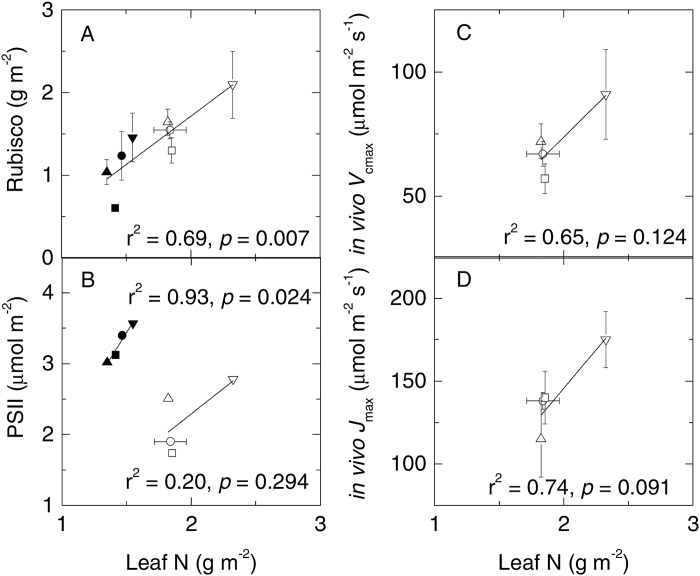
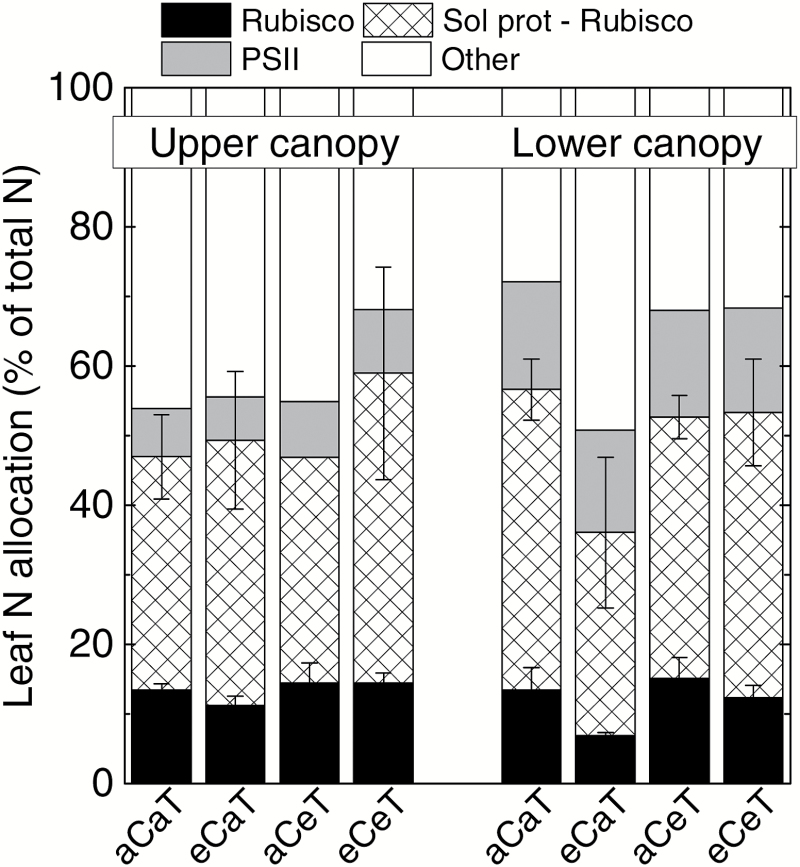
Leaf-level photosynthetic processes and their environmental dependencies are critical for estimating CO2 uptake from the atmosphere. These estimates use biochemical-based models of photosynthesis that require accurate Rubisco kinetics. We investigated the effects of canopy position, elevated atmospheric CO2 [eC; ambient CO2 (aC)+240 ppm] and elevated air temperature (eT; ambient temperature (aT)+3 °C) on Rubisco content and activity together with the relationship between leaf N and Vcmax (maximal Rubisco carboxylation rate) of 7 m tall, soil-grown Eucalyptus globulus trees. The kinetics of E. globulus and tobacco Rubisco at 25 °C were similar. In vitro estimates of Vcmax derived from measures of E. globulus Rubisco content and kinetics were consistent, although slightly lower, than the in vivo rates extrapolated from gas exchange. In E. globulus, the fraction of N invested in Rubisco was substantially lower than for crop species and varied with treatments. Photosynthetic acclimation of E. globulus leaves to eC was underpinned by reduced leaf N and Rubisco contents; the opposite occurred in response to eT coinciding with growth resumption in spring. Our findings highlight the adaptive capacity of this key forest species to allocate leaf N flexibly to Rubisco and other photosynthetic proteins across differing canopy positions in response to future, warmer and elevated [CO2] climates.
Keywords: Canopy position; Eucalyptus globulus; Rubisco kinetics; Vcmax; elevated CO2 and temperature; photosynthesis; whole-tree chambers..
© The Author 2017. Published by Oxford University Press on behalf of the Society for Experimental Biology.
Figures
References
-
- Adam NR, Wall GW, Kimball BA, et al. 2000. Acclimation response of spring wheat in a free-air CO(2) enrichment (FACE) atmosphere with variable soil nitrogen regimes. 1. Leaf position and phenology determine acclimation response. Photosynthesis Research 66, 65–77. - PubMed
-
- Ainsworth EA, Rogers A. 2007. The response of photosynthesis and stomatal conductance to rising [CO2]: mechanisms and environmental interactions. Plant, Cell and Environment 30, 258–270. - PubMed
-
- Barton CVM, Ellsworth DS, Medlyn BE, et al. 2010. Whole-tree chambers for elevated atmospheric CO2 experimentation and tree scale flux measurements in south-eastern Australia: the Hawkesbury Forest Experiment. Agricultural and Forest Meteorology 150, 941–951.
-
- Battaglia M, Beadle C, Loughhead S. 1996. Photosynthetic temperature responses of Eucalyptus globulus and Eucalyptus nitens. Tree Physiology 16, 81–89. - PubMed
Publication types
MeSH terms
Substances
LinkOut - more resources
Full Text Sources
Other Literature Sources
Medical
