

Dietary Protein Sources and Risk for Incident Chronic Kidney Disease: Results From the Atherosclerosis Risk in Communities (ARIC) Study
- PMID: 28065493
- PMCID: PMC5476496
- DOI: 10.1053/j.jrn.2016.11.004
Dietary Protein Sources and Risk for Incident Chronic Kidney Disease: Results From the Atherosclerosis Risk in Communities (ARIC) Study
Abstract
Objective: Dietary protein restriction is recommended for patients with moderate to severe renal insufficiency. Long-term data on the relationship between dietary protein sources and risk for incident kidney disease in individuals with normal kidney function are largely missing. This study aimed to assess the association between dietary protein sources and incident chronic kidney disease (CKD).
Design: Prospective cohort.
Setting: Atherosclerosis Risk in Communities study participants from 4 US communities.
Subjects: A total of 11,952 adults aged 44-66 years in 1987-1989 who were free of diabetes mellitus, cardiovascular disease, and had an estimated glomerular filtration rate (eGFR) ≥ 60 mL/minute/1.73 m2.
Main outcome measure: A 66-item food frequency questionnaire was used to assess food intake. CKD stage 3 was defined as a decrease in eGFR of ≥25% from baseline resulting in an eGFR of less than 60 mL/minute/1.73 m2; CKD-related hospitalization; CKD-related death; or end-stage renal disease. Hazard ratios (HRs) and 95% confidence intervals (CIs) were estimated using Cox proportional hazards regression.
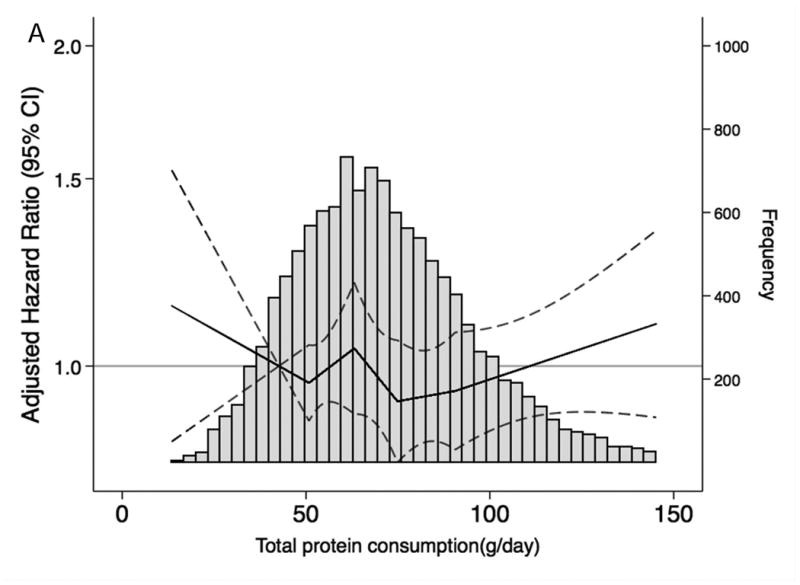
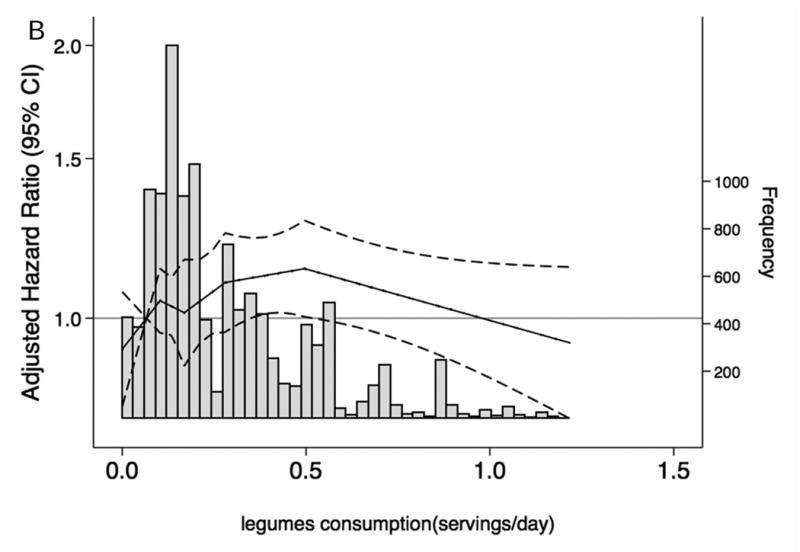
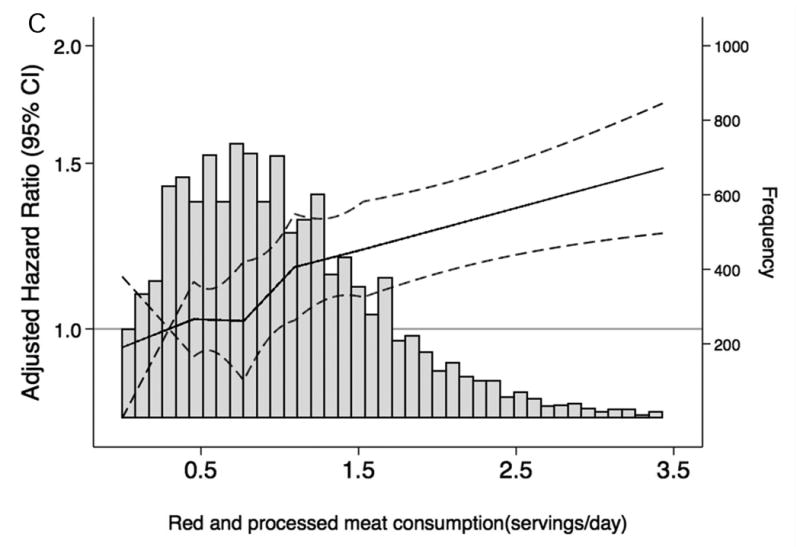
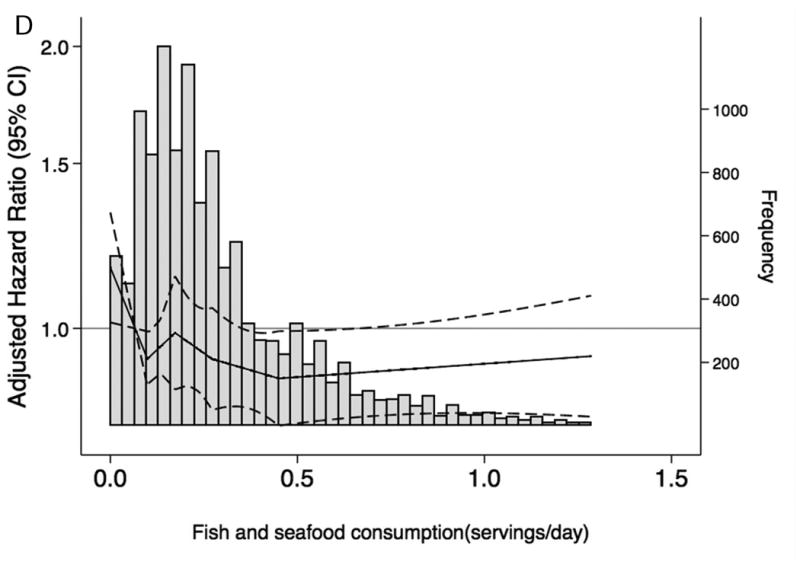
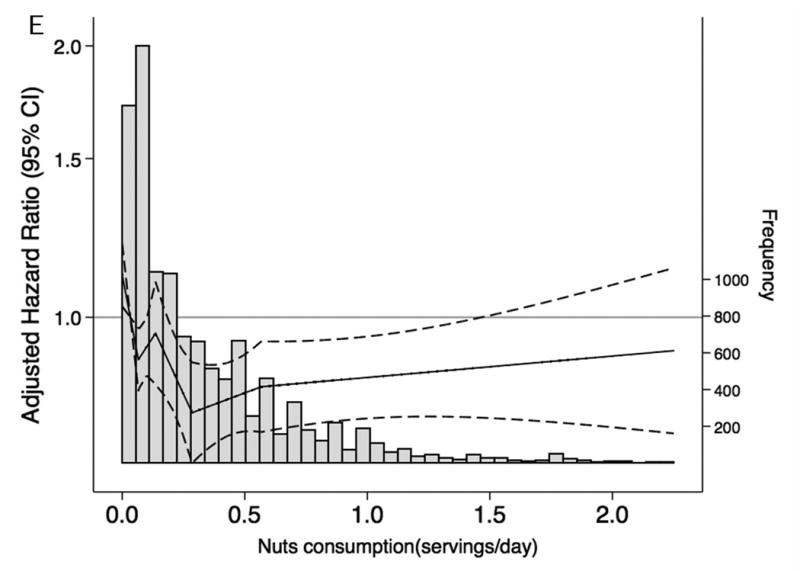
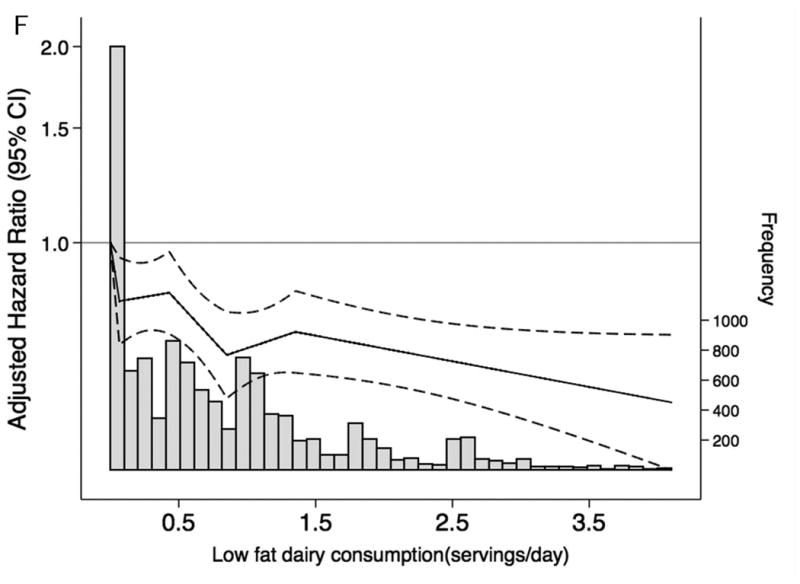
Results: During a median follow-up of 23 years, there were 2,632 incident CKD cases. Red and processed meat consumption was associated with increased CKD risk (HRQ5 vs. Q1: 1.23, 95% CI: 1.06-1.42, ptrend = 0.01). In contrast, higher dietary intake of nuts, legumes, and low-fat dairy products was associated with lower CKD risk (nuts: HRQ5 vs. Q1: 0.81, 95% CI: 0.72-0.92, ptrend <0.001; low-fat dairy products: HRQ5 vs. Q1: 0.75, 95% CI: 0.65-0.85, ptrend <0.001; legumes: HRQ5 vs. Q1: 0.83, 95% CI: 0.72-0.95, ptrend = 0.03).
Conclusion: There were varied associations of specific dietary protein sources with risk of incident CKD; with red and processed meat being adversely associated with CKD risk; and nuts, low-fat dairy products, and legumes being protective against the development of CKD.
Copyright © 2016 National Kidney Foundation, Inc. Published by Elsevier Inc. All rights reserved.
Figures
Comment in
-
Dietary Sources of Protein and Chronic Kidney Disease Progression: The Proof May Be in the Pattern.J Ren Nutr. 2017 Jul;27(4):221-224. doi: 10.1053/j.jrn.2017.04.001. Epub 2017 May 23. J Ren Nutr. 2017. PMID: 28549571 No abstract available.
Similar articles
-
Dietary Acid Load and Incident Chronic Kidney Disease: Results from the ARIC Study.Am J Nephrol. 2015;42(6):427-35. doi: 10.1159/000443746. Epub 2016 Jan 21. Am J Nephrol. 2015. PMID: 26789417 Free PMC article.
-
Relationship between carbohydrate-to-fat intake ratio and the development of chronic kidney disease: A community-based prospective cohort study.Clin Nutr. 2021 Oct;40(10):5346-5354. doi: 10.1016/j.clnu.2021.09.001. Epub 2021 Sep 9. Clin Nutr. 2021. PMID: 34555715
-
A Prospective Study of Dietary Meat Intake and Risk of Incident Chronic Kidney Disease.J Ren Nutr. 2020 Mar;30(2):111-118. doi: 10.1053/j.jrn.2019.06.008. Epub 2019 Aug 14. J Ren Nutr. 2020. PMID: 31422013
-
Diet and Kidney Function: a Literature Review.Curr Hypertens Rep. 2020 Feb 3;22(2):14. doi: 10.1007/s11906-020-1020-1. Curr Hypertens Rep. 2020. PMID: 32016564 Free PMC article. Review.
-
Association between dietary protein intake and risk of chronic kidney disease: a systematic review and meta-analysis.Front Nutr. 2024 Jun 14;11:1408424. doi: 10.3389/fnut.2024.1408424. eCollection 2024. Front Nutr. 2024. PMID: 38946781 Free PMC article.
Cited by
-
Healthy adult vegetarians have better renal function than matched omnivores: a cross-sectional study in China.BMC Nephrol. 2020 Jul 11;21(1):268. doi: 10.1186/s12882-020-01918-2. BMC Nephrol. 2020. PMID: 32652943 Free PMC article.
-
Nutrition, Immunology, and Kidney: Looking Beyond the Horizons.Curr Nutr Rep. 2022 Mar;11(1):69-81. doi: 10.1007/s13668-021-00388-8. Epub 2022 Jan 26. Curr Nutr Rep. 2022. PMID: 35080754 Review.
-
Healthy dietary patterns and the incidence of chronic kidney disease: results from a prospective cohort study.BMC Public Health. 2025 Feb 7;25(1):511. doi: 10.1186/s12889-025-21652-4. BMC Public Health. 2025. PMID: 39920675 Free PMC article.
-
Nutritional load in post-prandial oxidative stress and the pathogeneses of diabetes mellitus.NPJ Sci Food. 2024 Jun 27;8(1):41. doi: 10.1038/s41538-024-00282-x. NPJ Sci Food. 2024. PMID: 38937488 Free PMC article.
-
Glomerular Biomechanical Stress and Lipid Mediators during Cellular Changes Leading to Chronic Kidney Disease.Biomedicines. 2022 Feb 9;10(2):407. doi: 10.3390/biomedicines10020407. Biomedicines. 2022. PMID: 35203616 Free PMC article. Review.
References
-
- Brenner BM, Meyer TW, Hostetter TH. Dietary protein intake and the progressive nature of kidney disease: the role of hemodynamically mediated glomerular injury in the pathogenesis of progressive glomerular sclerosis in aging, renal ablation, and intrinsic renal disease. N Engl J Med. 1982;307:652–659. - PubMed
-
- King AJ, Levey AS. Dietary protein and renal function. J Am Soc Nephrol. 1993;3:1723–1737. - PubMed
-
- Meyer TW, Lawrence WE, Brenner BM. Dietary protein and the progression of renal disease. Kidney Int Suppl. 1983;16:S243–247. - PubMed
-
- Addis T, Drury DR. THE RATE OF UREA EXCRETION: VII. THE EFFECT OF VARIOUS OTHER FACTORS THAN BLOOD UREA CONCENTRATION ON THE RATE OF UREA EXCRETION. J Biol Chem. 1923;55:629–638.
-
- Jolliffe N, Smith HW. THE EXCRETION OF URINE IN THE DOG II. The Urea and Creatinine Clearances on a Mixed Diet. Am J Physiol. 1931;98:572–577.
Publication types
MeSH terms
Substances
Grants and funding
- HHSN268201100012C/HL/NHLBI NIH HHS/United States
- HHSN268201100009I/HL/NHLBI NIH HHS/United States
- HHSN268201100010C/HL/NHLBI NIH HHS/United States
- HHSN268201100008C/HL/NHLBI NIH HHS/United States
- HHSN268201100005G/HL/NHLBI NIH HHS/United States
- HHSN268201100008I/HL/NHLBI NIH HHS/United States
- R01 DK089174/DK/NIDDK NIH HHS/United States
- HHSN268201100007C/HL/NHLBI NIH HHS/United States
- K01 DK107782/DK/NIDDK NIH HHS/United States
- HHSN268201100011I/HL/NHLBI NIH HHS/United States
- HHSN268201100011C/HL/NHLBI NIH HHS/United States
- HHSN268201100006C/HL/NHLBI NIH HHS/United States
- HHSN268201100005I/HL/NHLBI NIH HHS/United States
- K24 DK106414/DK/NIDDK NIH HHS/United States
- HHSN268201100009C/HL/NHLBI NIH HHS/United States
- HHSN268201100005C/HL/NHLBI NIH HHS/United States
- HHSN268201100007I/HL/NHLBI NIH HHS/United States
LinkOut - more resources
Full Text Sources
Other Literature Sources
Medical
Research Materials
Miscellaneous
