. 2017 Jan 19;65(2):347-360.
doi: 10.1016/j.molcel.2016.12.004. Epub 2017 Jan 5.

A Global Analysis of the Receptor Tyrosine Kinase-Protein Phosphatase Interactome

Affiliations

A Global Analysis of the Receptor Tyrosine Kinase-Protein Phosphatase Interactome

Zhong Yao et al. Mol Cell. .

Abstract

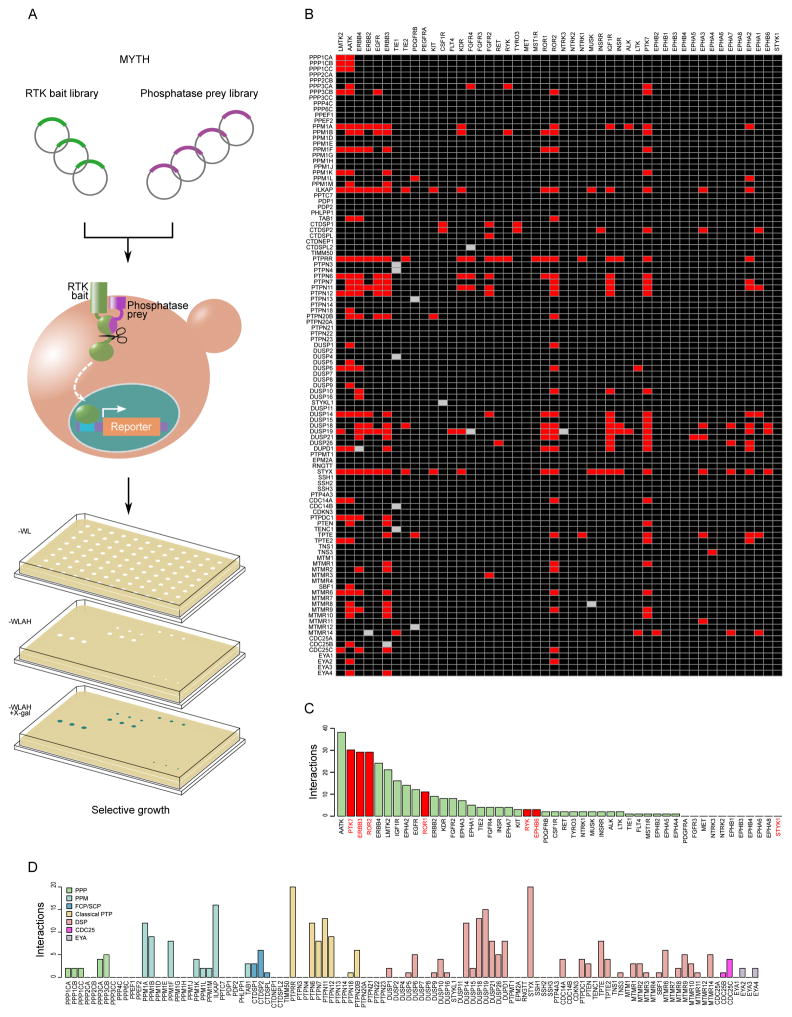
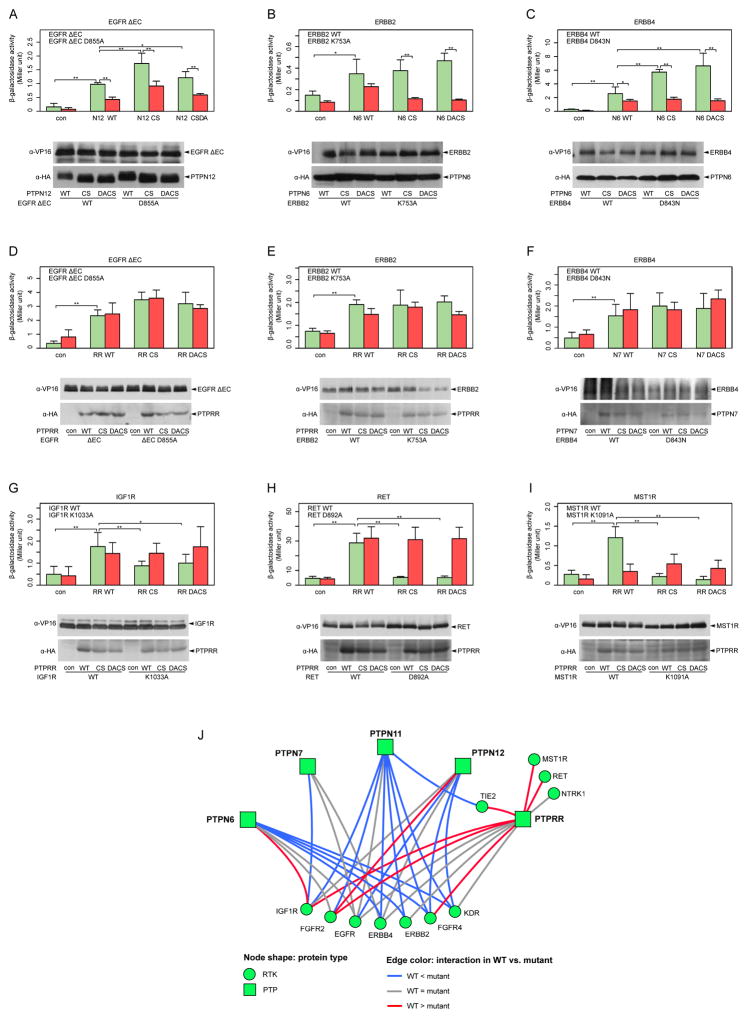
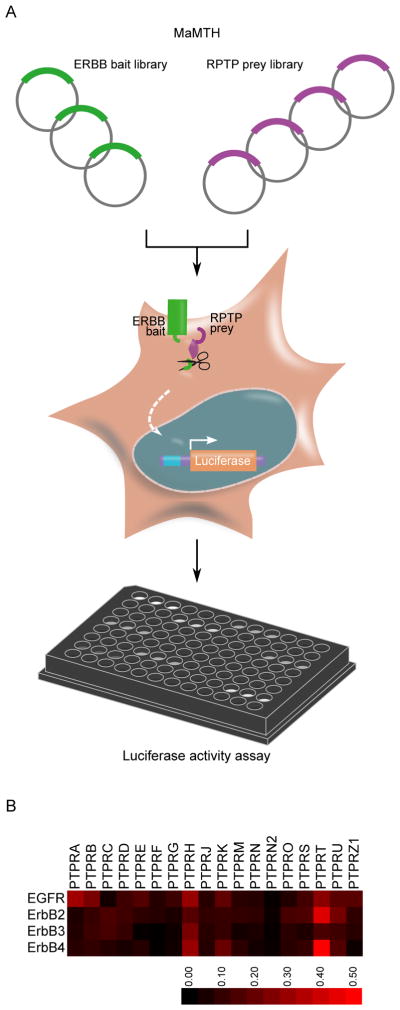
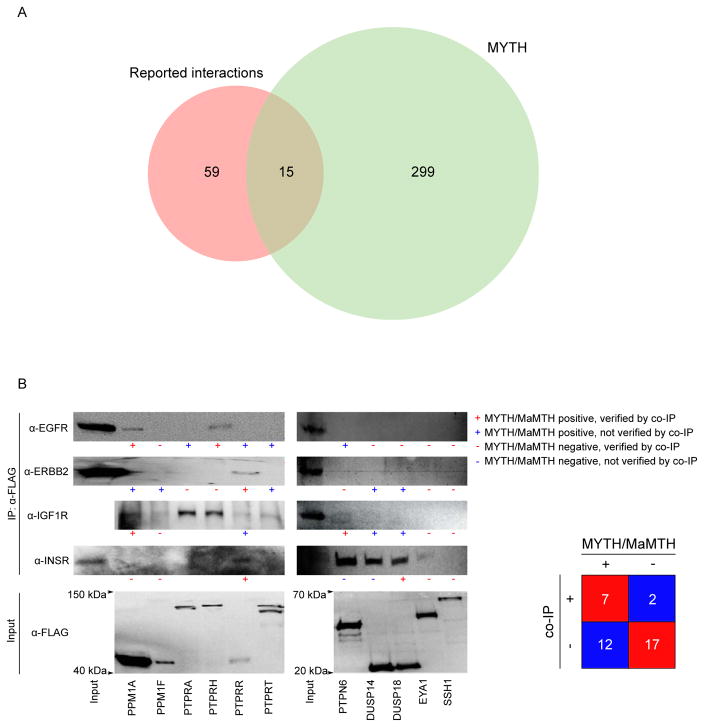
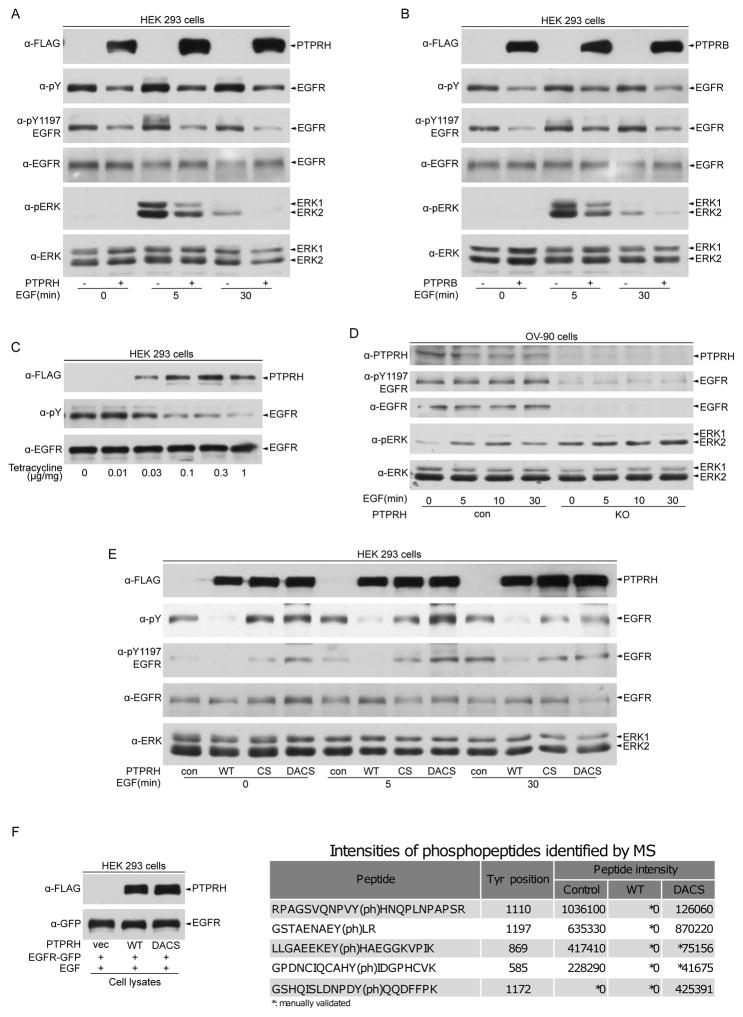
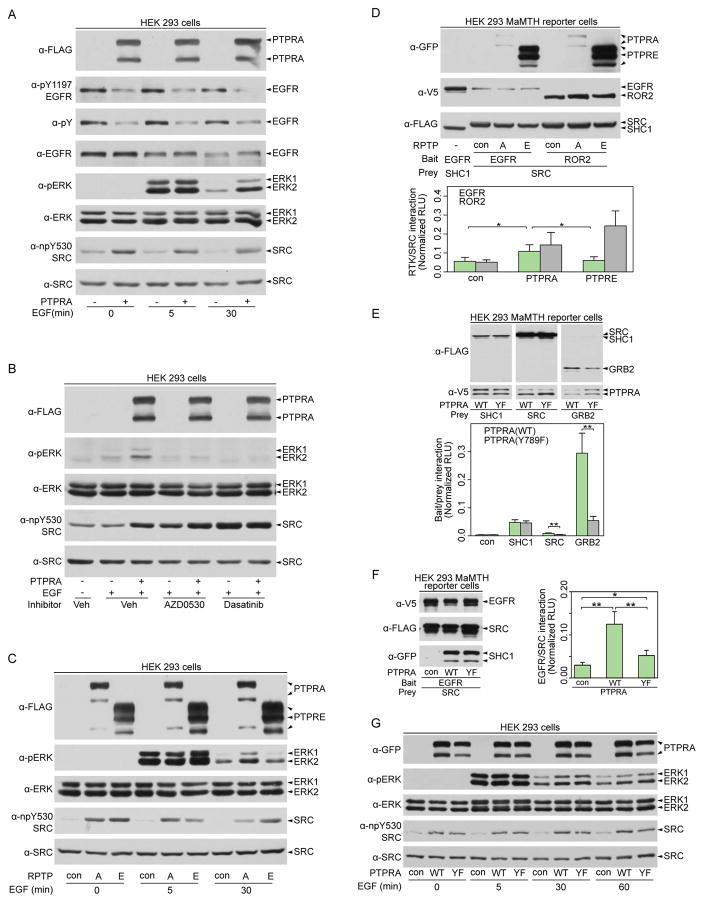
Receptor tyrosine kinases (RTKs) and protein phosphatases comprise protein families that play crucial roles in cell signaling. We used two protein-protein interaction (PPI) approaches, the membrane yeast two-hybrid (MYTH) and the mammalian membrane two-hybrid (MaMTH), to map the PPIs between human RTKs and phosphatases. The resulting RTK-phosphatase interactome reveals a considerable number of previously unidentified interactions and suggests specific roles for different phosphatase families. Additionally, the differential PPIs of some protein tyrosine phosphatases (PTPs) and their mutants suggest diverse mechanisms of these PTPs in the regulation of RTK signaling. We further found that PTPRH and PTPRB directly dephosphorylate EGFR and repress its downstream signaling. By contrast, PTPRA plays a dual role in EGFR signaling: besides facilitating EGFR dephosphorylation, it enhances downstream ERK signaling by activating SRC. This comprehensive RTK-phosphatase interactome study provides a broad and deep view of RTK signaling.

Keywords: MYTH; MaMTH; PTP; PTPRA; PTPRB; PTPRH; RTK; SRC; dephosphorylation; phosphatase.


Figures

Figure 1
Figure 1. RTK-phosphatase interactome, as revealed by MYTH (see also Figure S1)
A. Scheme for RTK-phosphatase interactome studies using MYTH. RTK baits and phosphatases were co-transformed individually into yeast cells. Interactions were measured as growth on selective medium (SD-WLAH), or the same medium supplemented with x-gal. B. RTK-phosphatase interactions are presented as a heat-map. Red rectangles stand for positive interactions and black rectangles indicate no interaction. Failure of the assay for a given pair is shown in grey. C. Number of MYTH interactions for each RTK bait. Pseudokinases are indicated in red. D. Number of interactions for each phosphatase categorized into family groups indicated by color.
Figure 2
Figure 2. PTP-inactive mutants demonstrate different interaction behaviors with RTKs in MYTH (see also Figures S2 and S3)
A–I. Representative RTK-PTP mutant interactions were quantified by ONPG assay. Each column represents mean± SD (n=6). Significance was assessed by one-tailed Student’s t-test. *: P<0.05, **: P<0.01. The expression level of each protein was determined by immunoblotting using anti-tag antibodies, VP16 for bait and HA for prey. J. Interaction network between RTKs and PTP-inactive mutants. Interactions are grouped into three categories highlighted in edge color. Red indicates increased interaction in trapping mutants. Grey represents no obvious difference. Decreased interaction of PTP mutants is represented by blue color.
Figure 3
Figure 3. MaMTH assay identifies multiple ERBB-RPTP interactions
A. Scheme of MaMTH assay. An ERBB bait was co-transfected with a RPTP prey into reporter cells. Interaction was measured as luciferase activity. B. ERBB-RPTP interactions are presented as heat-map. Signals were normalized by the EGFR-SHC1 interaction used as positive control. Each pixel represents the average of triplicate determinations.
Figure 4
Figure 4. Validation of the RTK-phosphatase interactome (see also Figure S4)
A. The RTK-phosphatase interactome revealed by MYTH is compared with previously reported interactions from IID. B. Validation of selected RTK-phosphatase interactions by co-IP. Indicated FLAG-tagged phosphatases were integrated into Flp-In T-Rex HEK293 cells and their expression was induced by tetracycline. They were precipitated with α-FLAG antibody, and their interactions with endogenous RTKs were probed by antibodies against indicated RTKs. The MYTH/MaMTH results for each pair are highlighted as + or – beneath each band with red color if validated, or blue if not confirmed by co-IP.
Figure 5
Figure 5. PTPRH and PTPRB are EGFR inhibitory phosphatases (see also Figures S5 and Table S1)
A–B. PTPRH-FLAG (A) or PTPRB-FLAG (B) was transfected into HEK293 cells. The cells were stimulated with EGF followed by Western blot analysis. C. Dose-response impact of PTPRH on EGFR phosphorylation. PTPRH-FLAG was integrated into FlpIn T-REx HEK293 cells and its expression was controlled by different concentrations of tetracycline. PTPRH expression and EGFR phosphorylation were measured by Western blot analysis. D. PTPRH was deleted in OV-90 cells by CRISPR/Cas9 technology. The WT and PTPRH knockout cells were stimulated with EGF and the lysates were subject to Western blot analysis. E. PTPRH CS or DACS mutant was expressed in HEK293 cells, and their effects on EGFR were investigated by Western blotting analysis. F. EGFR-GFP and PTPRH-FLAG (WT or DACS mutant) were co-transfected into HEK293 cells. After stimulation with EGF for 5 min, EGFR was precipitated by α–GFP antibody and subject to MS analysis. The intensities of EGFR phosphopeptides are listed in the right panel. Lysates were also analysed by Western blotting analysis (left).
Figure 6
Figure 6. PTPRA is involved in EGFR signaling (see also Figures S6)
A. HEK293 cells were transfected with PTPRA-FLAG followed by EGF stimulation. Lysates were subject to Western blot analysis. B. PTPRA-FLAG-transfected HEK293 cells were pretreated with SRC inhibitors, AZD0530, or Dasatinib, or vehicle (Veh) for 30 min. After EGF stimulation for 30 min, the cells were subject to Western blot analysis. C. HEK293 cells transfected with PTPRA-FLAG or PTPRE-FLAG were stimulated with EGF and subject to Western blot analysis. D. EGFR or ROR2 (control) bait and SRC prey together with PTPRA-GFP or PTPRE-GFP were transfected into reporter cells. EGFR-SRC interaction was assessed by MaMTH (lower panel). Signals were normalized by EGFR/SHC1 interaction. Data represent mean± SD (n=4). Significance was assessed by one-tailed Student’s t-test. *: P<0.05. The expression of each protein was measured by Western blot analysis (upper panel). E. MaMTH assay using PTPRA (WT or Y789F mutant) as bait and PEX13 (negative control), SHC1, SRC or GRB2 as prey. Data represent mean± SD (n=3). Significance was assessed by one-tailed Student’s t-test. **: P<0.01. Expression of each protein is shown in the upper panel. F. MaMTH assay with EGFR bait and SRC prey in the presence of WT or Y789F PTPRA mutant. Data represent mean± SD deviation (n=3). Significance was assessed by one-tailed Student’s t-test. *: P<0.05; **: P<0.01. Protein expression is shown in the left panel. G. GFP-tagged PTPRA (WT or Y789F mutant) was transfected into HEK 293 cells. After EGF stimulation, the cells were subject to Western blot analysis using the indicated antibodies.

References

    1. Akbarzadeh S, Wheldon LM, Sweet SMM, Talma S, Mardakheh FK, Heath JK. The deleted in Brachydactyly B domain of ROR2 is required for receptor activation by recruitment of Src. PLoS One. 2008;3:e1873. - PMC - PubMed
    1. Alonso A, Sasin J, Bottini N, Friedberg I, Friedberg I, Osterman A, Godzik A, Hunter T, Dixon J, Mustelin T. Protein tyrosine phosphatases in the human genome. Cell. 2004;117:699–711. - PubMed
    1. Andersen JN, Jansen PG, Echwald SM, Mortensen OH, Fukada T, Del Vecchio R, Tonks NK, Møller NPH. A genomic perspective on protein tyrosine phosphatases: gene structure, pseudogenes, and genetic disease linkage. FASEB J. 2004;18:8–30. - PubMed
    1. Blanco-Aparicio C, Torres J, Pulido R. A novel regulatory mechanism of MAP kinases activation and nuclear translocation mediated by PKA and the PTP-SL tyrosine phosphatase. J Cell Biol. 1999;147:1129–1135. - PMC - PubMed
    1. Breuer K, Foroushani AK, Laird MR, Chen C, Sribnaia A, Lo R, Winsor GL, Hancock REW, Brinkman FSL, Lynn DJ. InnateDB: Systems biology of innate immunity and beyond - Recent updates and continuing curation. Nucleic Acids Res. 2013;41:D1228–1233. - PMC - PubMed

MeSH terms

Substances