. 2017 Feb 7;25(2):448-462.
doi: 10.1016/j.cmet.2016.12.008. Epub 2017 Jan 5.

Adipocyte Dynamics and Reversible Metabolic Syndrome in Mice with an Inducible Adipocyte-Specific Deletion of the Insulin Receptor

Affiliations

Adipocyte Dynamics and Reversible Metabolic Syndrome in Mice with an Inducible Adipocyte-Specific Deletion of the Insulin Receptor

Masaji Sakaguchi et al. Cell Metab. .

Abstract

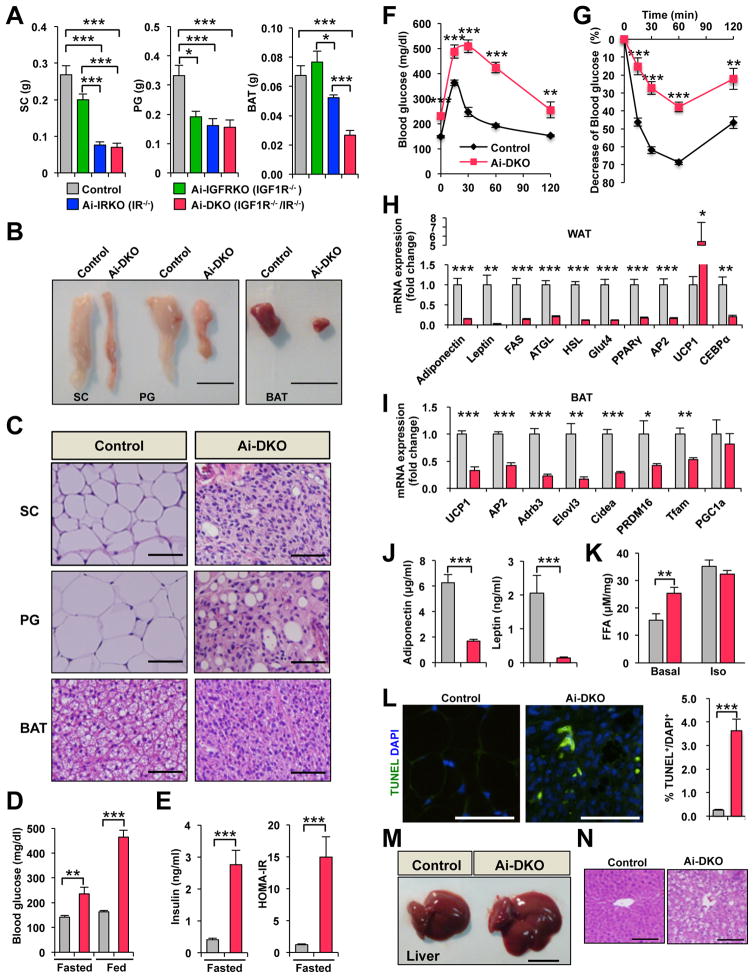
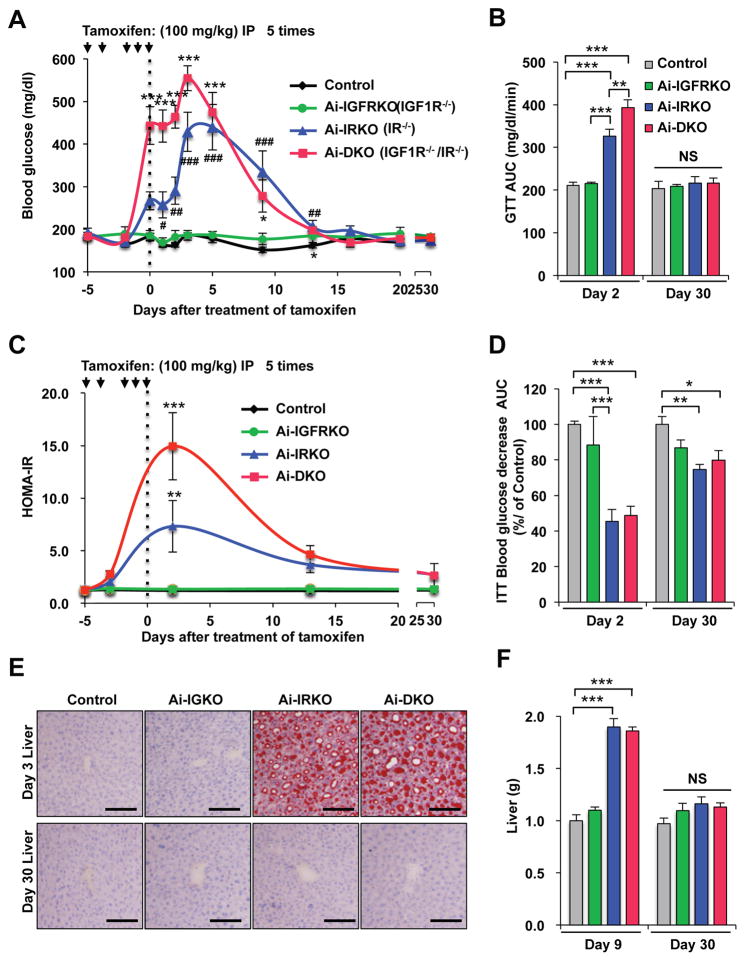
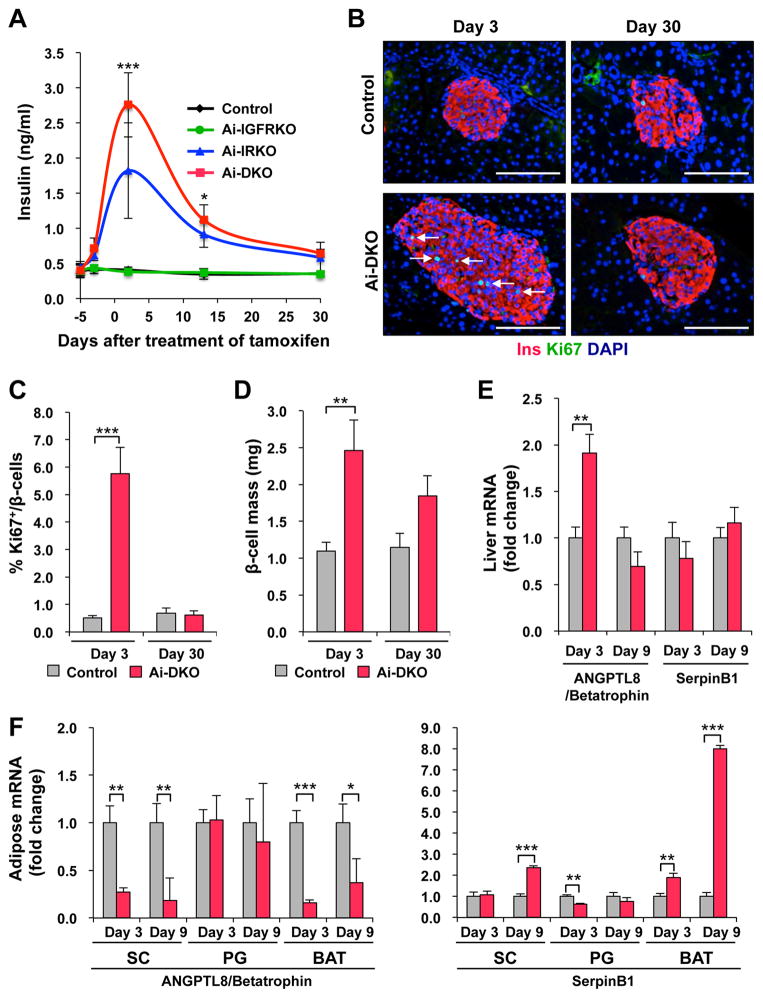
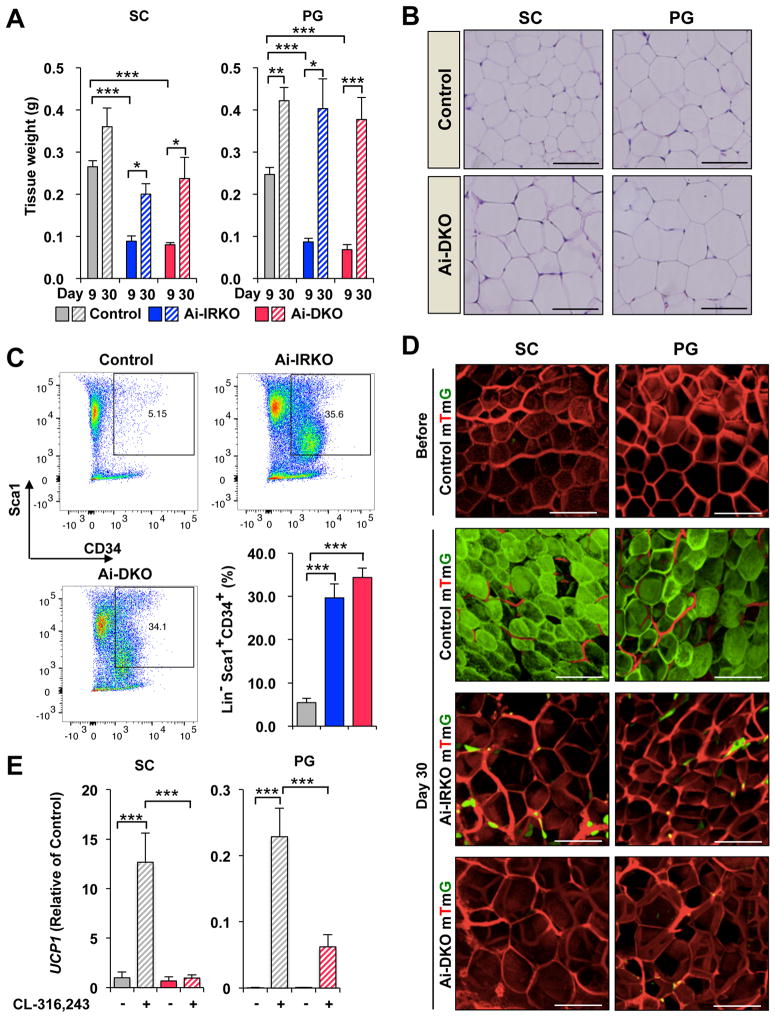
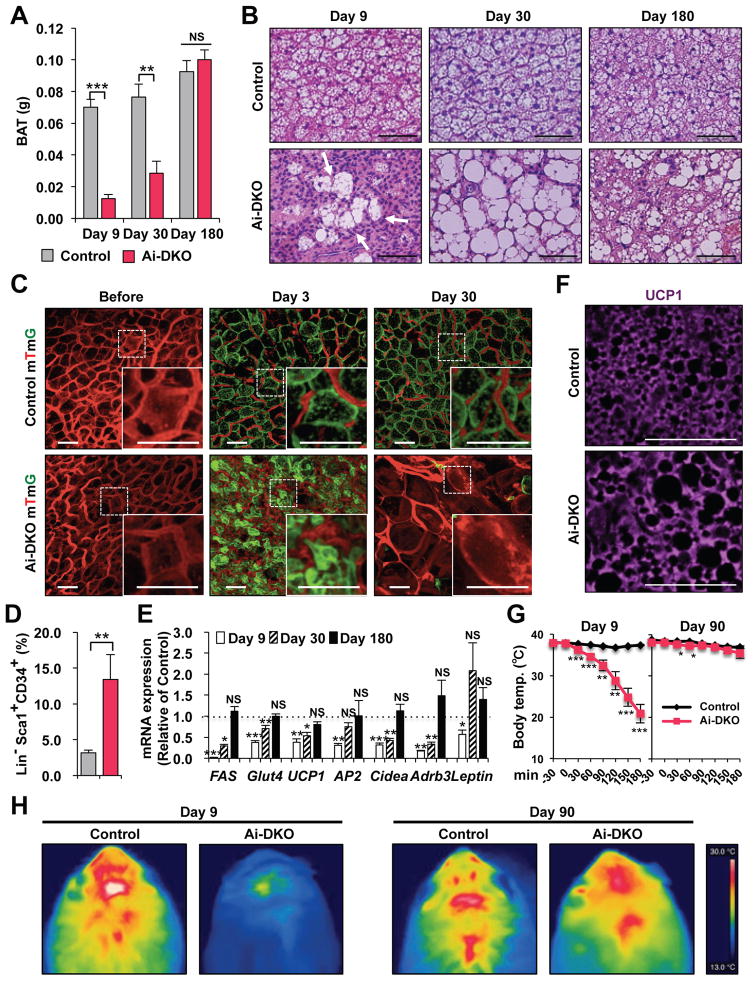
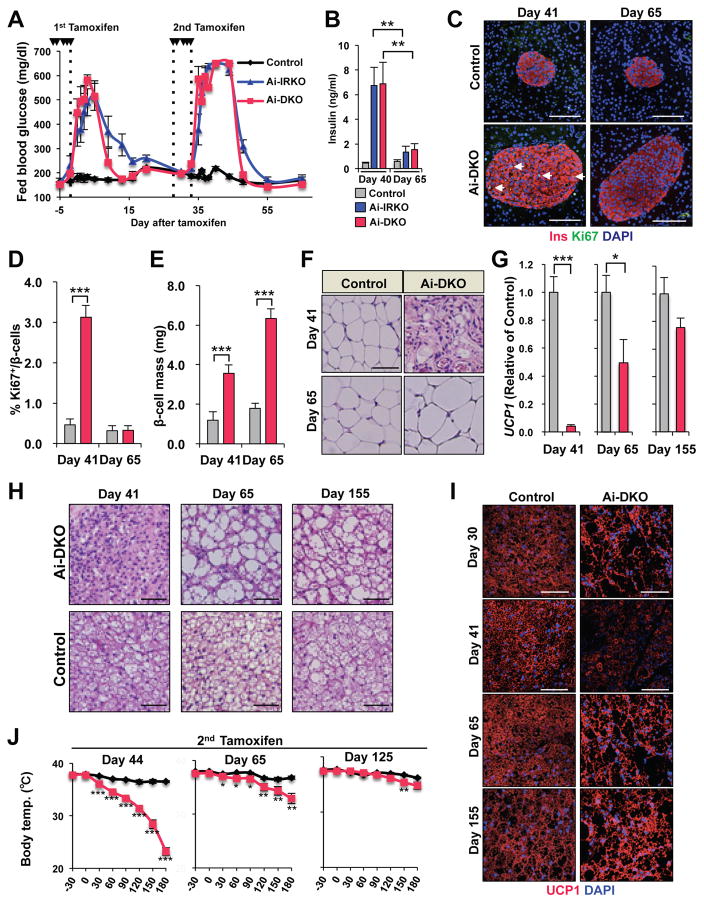
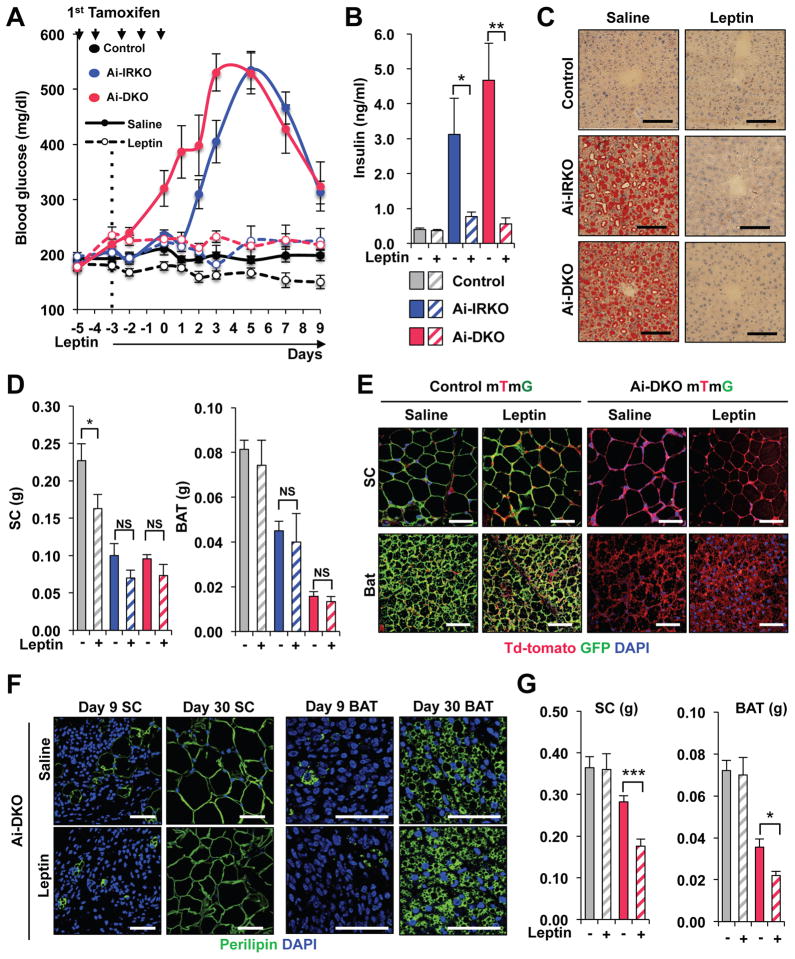
Insulin and IGF1 signaling are important for adipose tissue development and function; however, their role in mature adipocytes is unclear. Mice with a tamoxifen-inducible knockout of insulin and/or IGF1 receptors (IR/IGF1R) demonstrate a rapid loss of white and brown fat due to increased lipolysis and adipocyte apoptosis. This results in insulin resistance, glucose intolerance, hepatosteatosis, islet hyperplasia with hyperinsulinemia, and cold intolerance. This phenotype, however, resolves over 10-30 days due to a proliferation of preadipocytes and rapid regeneration of both brown and white adipocytes as identified by mTmG lineage tracing. This cycle can be repeated with a second round of receptor inactivation. Leptin administration prior to tamoxifen treatment blocks development of the metabolic syndrome without affecting adipocyte loss or regeneration. Thus, IR is critical in adipocyte maintenance, and this loss of adipose tissue stimulates regeneration of brown/white fat and reversal of metabolic syndrome associated with fat loss.

Keywords: adipocyte regeneration; adipogenesis; brown adipocyte; fatty liver; insulin action; insulin receptor knockout; insulin resistance; leptin; lineage tracing; β cell proliferation.


Conflict of interest statement

The authors declare no competing financial interests.

Figures

Figure 1
Figure 1
Physiology of mice with acute disruption of IR and/or IGF1R in fat. All data are from male mice 7–8 weeks of age on normal chow diet. Day 0 is the day of the last tamoxifen dose. (A) Tissue weights of SC-WAT, PG-WAT, and BAT in Control (n = 13), Ai-IGFRKO (IGF1R−/−) (n = 6), Ai-IRKO (IR−/−) (n = 13) and Ai-DKO (IGF1R−/− IR−/−) (n = 12) day 3 after treatment with tamoxifen. (B) Representative pictures of adipose tissue of Control and Ai-DKO at day 3. Scale bars indicate 1 cm. (C) HE stained sections of adipose tissue at day 3. Scale bars, 50 μm. (D) Blood glucose levels of Control (n = 13) and Ai-DKO (n = 14) under fed and fasted conditions at day 2. (E) Serum insulin and HOMA-IR levels of Control (n = 13) and Ai-DKO (n = 14) under fasting conditions at day 2. (F) OGTT on day 2 for Control (n = 13) and Ai-DKO (n = 12). (G) ITT on day 2 (n = 10/genotype) (H) mRNA expression measured by real-time qPCR in SC-WAT from Control (n = 7) and Ai-DKO (n = 6) at day 3. (I) mRNA abundance measured by real-time qPCR in BAT from Control (n = 7) and Ai-DKO (n = 6) at day 3. (J) Serum adiponectin and leptin concentrations at day 2 (n = 5/genotype). (K) Lipolysis assessed by FFA release from SC-WAT of Control (n = 5) and Ai-DKO (n = 7) at day 1.5. Samples were incubated ex vivo for 2 h at 37 °C in the presence or absence of 10 μM isoprenaline, and FFA released into the medium was quantified. (L) SC-WAT sections from Control and Ai-DKO were stained for TUNEL and DAPI at day 3 (left) and quantitated (n = 6/genotype) (right). (M) Representative pictures of liver in Control and Ai-DKO at day 3. Scale bar indicates 1 cm. (N) Liver tissue sections stained with HE in Control and Ai-DKO at day 3. Scale bars, 100 μm. Statistical significance is shown as p<0.05 (*), p<0.01 (**), and p<0.001 (***).
Figure 2
Figure 2
Recovery from insulin resistance and glucose intolerance in mice after tamoxifen-treatment. Tamoxifen was administered 5 times over 6 days as indicated by arrows. The day of final injection was considered experimental day 0. (A) Fed glucose levels in Control (n = 17), Ai-IGFRKO (n = 12), Ai-IRKO (n = 12) and Ai-DKO (n = 14) before and after tamoxifen-treatment. (B) HOMA-IR levels at days −3, 3, 13 and 30 of the experiment. (C) Comparison of GTT at day 2 and 30 after tamoxifen-treatment. (D) ITT at day 2 and 30. (E) Liver tissue sections stained with Oil Red O for Control, Ai-IRKO, Ai-IGFRKO and Ai-DKO at day 3 and 30. Scale bars, 100 μm. (F) Liver weights in Control (gray, n = 6), Ai-DKO (red, n = 6) at day 9 and 30. Statistical significance is indicated as p<0.05 (*), p<0.01 (**), p<0.001 (***), and NS = not significant.
Figure 3
Figure 3
Effect of the insulin resistance of acquired lipodystrophy on β-cell replication, mass, and function. (A) Fasting serum insulin measured at days −3, 3, 13 and 30 of the experiment. (B) Pancreatic sections were immunostained for insulin and Ki67 in Control and Ai-DKO at day 3 and day 30 after tamoxifen treatment. Scale bars, 100 μm. (C) Quantification of Ki67+insulin+ cells in Control (n = 4–7) and Ai-DKO (n = 4–6) pancreas sections at day 3 and 30. (D) Quantitation of β-cell mass at day 3 and 30 (see Supplementary Experimental Procedures). (E) mRNA abundance measured by real-time qPCR in liver from Control (n = 7) and Ai-DKO (n = 6) at days 3 and 9. (F) Expression levels of mRNA measured by real-time PCR in SC, PG and BAT from Control and Ai-DKO at days 3 and 9 (n = 5–7 per group). Statistical significance is as in Figure 2.
Figure 4
Figure 4
Regeneration of WAT in Ai-IRKO and Ai-DKO. (A) Recovery of tissue weights of SC and PG-WAT in Ai-IRKO (n = 6–7) and Ai-DKO (n = 6) at day 9 to 30 after tamoxifen-treatment compared to Control (n = 6). (B) SC and PG-WAT sections with HE in Control and Ai-DKO at day 30. Scale bars, 50 μm. (C) FACS profiles of sorted subcutaneous adipose SVF at day 3 from Control (n = 11), Ai-IRKO (n = 9) and Ai-DKO (n = 6). The live cells of the lineage-negative (Lin) population, i.e. lacking of CD31, CD45 and Ter119 expression, were considered preadipocyte on the basis of positive Sca1 and CD34 expression. Representative data are indicated as the FACS profiles, and the averages are shown in the right graph. (D) mTmG labeling of mature SC and PG adipocytes in Control, Ai-IRKO and Ai-DKO before and on day 30 after tamoxifen treatment. Scale bars, 100 μm. (E) qPCR of Ucp1 gene expression in SC (left) and PG-WAT (right) from Control and Ai-DKO male mice treated with CL-316,243 (1 mg/kg) or vehicle for 7 days (n = 5–7 per group). Results are expressed as fold change over the Control SC (vehicle) group. Statistical significance is as in Figure 2.
Figure 5
Figure 5
Brown adipocyte regeneration in Ai-DKO. (A) Recovery of tissue weights of BAT in Ai-DKO (n = 5–6) male mice at day 9, 30, and 180 after tamoxifen-treatment compared to Control (n=6–8). (B) H & E staining of BAT sections on day 9, 30 and 180. Scale bars, 50 μm. (C) mTmG lineage tracing of brown adipocytes in BAT of Control and Ai-DKO also carrying a Rosa- mTmG transgene as in Supplementary Figure 3C before and on days 3 and 30 after tamoxifen-treatment. Scale bars, 50 μm. (D) Percentage of Sca1+/CD34+ preadipocytes cells in brown adipose (Lin) SVF at day 3 in Control (n = 10) and Ai-DKO (n = 6). (E) Relative mRNA levels in Ai-DKO (n=5–6) and Control (n = 6–7) on days 9, 30 and 180 after tamoxifen-treatment. (F) UCP1 expression in BAT assessed by anti-UCP1 immunostaining in Control and Ai-DKO at day 180. (G) Rectal temperature in Control and Ai-DKO at day 9 and 90 during a 3 h exposure to an 8 °C environment (n = 5 per group). (H) Thermal images using a FLIR T300 Infrared Camera showing surface temperature over interscapular BAT after 2 h at 8 °C between Control and Ai-DKO on day 9 and 90. Statistical significance is as in Figure 2
Figure 6
Figure 6
Regeneration potential of WAT and BAT after two rounds of tamoxifen-treatment, with the second round given 5 times over 6 days between days 30 and 35. (A) Fed blood glucose levels after 1st and 2nd rounds of tamoxifen in Control (n = 9), Ai-IRKO (n = 6) and Ai-DKO (n = 5). (B) Serum insulin was measured in Ai-IRKO and Ai-DKO at days 40 and 65 compared with Control (n = 5–7 per group). p<0.05 = ** and p<0.001 = ***. (C) Pancreatic sections from Control and Ai-DKO were stained for insulin and Ki67 at days 41 and 65 after tamoxifen treatment. Scale bars, 100 μm. (D) Quantitation of Ki67+insulin+ cells in Control (n = 5–7) and Ai-DKO (n = 5–7) pancreas at days 41 and 65 after tamoxifen-treatment. (E) Quantitation of β-cell mass in Control (n = 4–7) and Ai-DKO (n = 4–7) pancreases at days 41 and 65. (F) HE sections of SC-WAT from Control and Ai-DKO mice at days 41 and 65. Scale bars, 50 μm. (G) Relative UCP1 mRNA levels in Ai-DKO (n = 4–6) and Controls (n = 4–10) at day 41, 65 and 155. (H) HE sections of BAT from Control and Ai-DKO at days 41, 65 and 155. Scale bars, 50 μm. (I) UCP1 expression in BAT by anti-UCP1 immunostaining in Control and Ai-DKO at days 30, 41, 65 and 155. Scale bars, 50 μm. (J) Rectal temperature in male Control and Ai-DKO taken every 30 min for 3 h during exposure to an 8 °C environment (n = 5 per group) at days 44, 65 and 125. Comparison of rectal temperature drop after 3 h of 4 °C challenge in Control and Ai-DKO (right). Statistical significance is as in Figure 2..
Figure 7
Figure 7. Leptin inhibits the hyperglycemia and hepatic steatosis but not the regeneration of white and brown adipocytes in Ai-DKO
(A) Effect of leptin treatment on hyperglycemia induced by gene recombination in Ai-IRKO and Ai-DKO compared to Controls (n = 5–7 per group). Leptin (10 mg/day) was administered using Alzet 1002 minipumps between day −3 and day 9 surrounding tamoxifen-treatment. (B) Fasted serum insulin concentrations at day 3 after tamoxifen-treatment with or without leptin (n = 5–7 per group). (C) Liver sections stained with Oil Red O for Control, Ai-IRKO and Ai-DKO with saline or leptin at day 3. Scale bars, 100 μm. (D) Weights of SC and BAT fat at day 9 in Ai-IRKO (Saline: n=6, leptin: n=5), Ai-DKO (Saline: n = 7, leptin: n = 6) and Control (Saline: n = 9, leptin: n = 7). (E) Immunofluorescence staining for GFP (green), Td-tomato (red) and DAPI (blue) in SC-WAT and BAT from Control mTmG and Ai-DKO mTmG, as indicated, at day 30. Scale bars, 50 μm. (F) Perilipin (green) staining of SC and BAT in Ai-DKO (with saline or leptin) at day 9 and 30. Scale bars, 50 μm. (G) Tissue weights of SC and BAT at day 30 in Ai-DKO (Saline: n = 9, leptin: n = 5) and Control (Saline: n = 9, leptin: n = 5). Statistical significance is as in Figure 2.

References

    1. Alonso LC, Yokoe T, Zhang P, Scott DK, Kim SK, O’Donnell CP, Garcia-Ocana A. Glucose infusion in mice: a new model to induce beta-cell replication. Diabetes. 2007;56:1792–1801. - PMC - PubMed
    1. Arner E, Westermark PO, Spalding KL, Britton T, Ryden M, Frisen J, Bernard S, Arner P. Adipocyte turnover: relevance to human adipose tissue morphology. Diabetes. 2010;59:105–109. - PMC - PubMed
    1. Arner P, Bernard S, Salehpour M, Possnert G, Liebl J, Steier P, Buchholz BA, Eriksson M, Arner E, Hauner H, et al. Dynamics of human adipose lipid turnover in health and metabolic disease. Nature. 2011;478:110–113. - PMC - PubMed
    1. Bluher M, Michael MD, Peroni OD, Ueki K, Carter N, Kahn BB, Kahn CR. Adipose tissue selective insulin receptor knockout protects against obesity and obesity-related glucose intolerance. Dev Cell. 2002;3:25–38. - PubMed
    1. Bouchard C, Despres JP, Mauriege P. Genetic and nongenetic determinants of regional fat distribution. EndocrRev. 1993;14:72–93. - PubMed

Publication types

MeSH terms