. 2016 Dec 23:10:139.
doi: 10.3389/fncom.2016.00139. eCollection 2016.

Serial Spike Time Correlations Affect Probability Distribution of Joint Spike Events

Affiliations

Serial Spike Time Correlations Affect Probability Distribution of Joint Spike Events

Mina Shahi et al. Front Comput Neurosci. .

Abstract

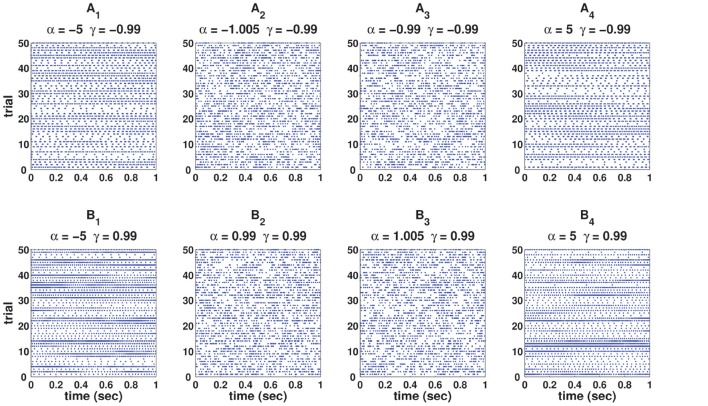
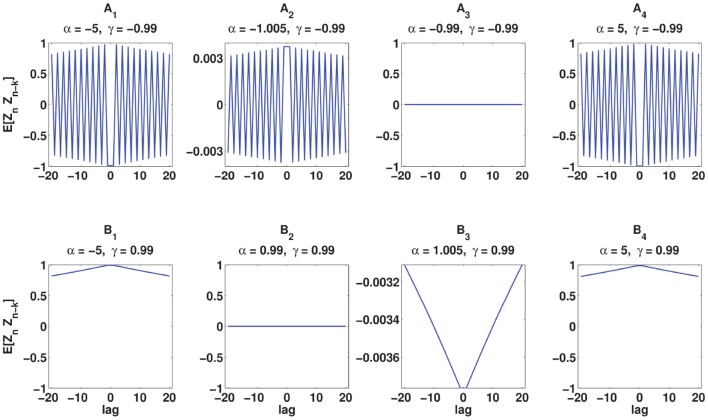
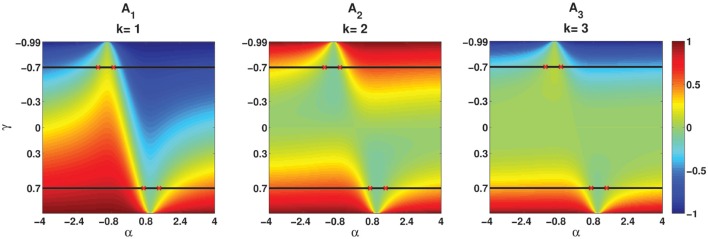
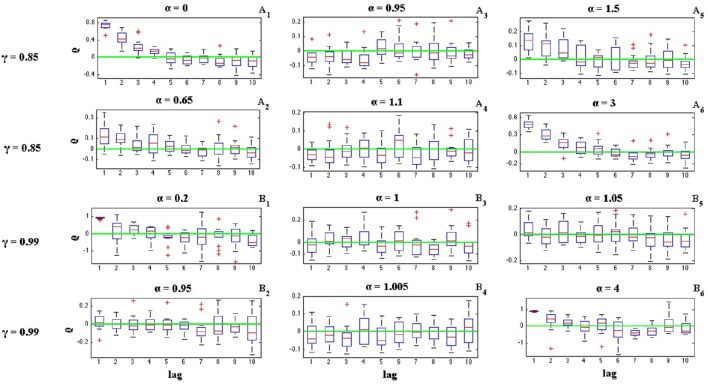
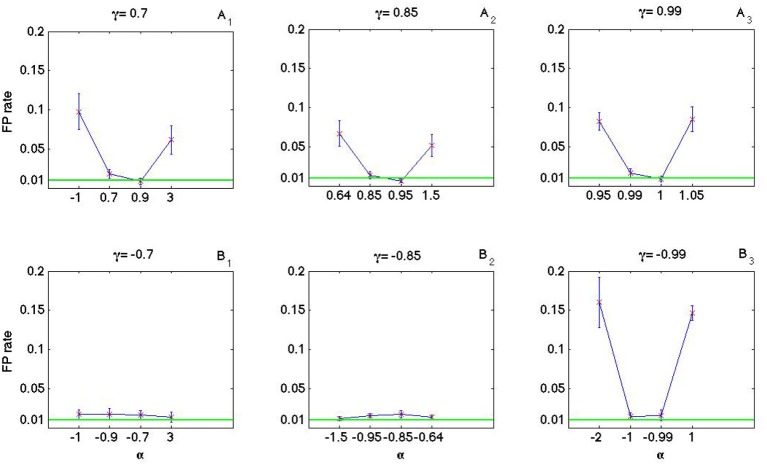
Detecting the existence of temporally coordinated spiking activity, and its role in information processing in the cortex, has remained a major challenge for neuroscience research. Different methods and approaches have been suggested to test whether the observed synchronized events are significantly different from those expected by chance. To analyze the simultaneous spike trains for precise spike correlation, these methods typically model the spike trains as a Poisson process implying that the generation of each spike is independent of all the other spikes. However, studies have shown that neural spike trains exhibit dependence among spike sequences, such as the absolute and relative refractory periods which govern the spike probability of the oncoming action potential based on the time of the last spike, or the bursting behavior, which is characterized by short epochs of rapid action potentials, followed by longer episodes of silence. Here we investigate non-renewal processes with the inter-spike interval distribution model that incorporates spike-history dependence of individual neurons. For that, we use the Monte Carlo method to estimate the full shape of the coincidence count distribution and to generate false positives for coincidence detection. The results show that compared to the distributions based on homogeneous Poisson processes, and also non-Poisson processes, the width of the distribution of joint spike events changes. Non-renewal processes can lead to both heavy tailed or narrow coincidence distribution. We conclude that small differences in the exact autostructure of the point process can cause large differences in the width of a coincidence distribution. Therefore, manipulations of the autostructure for the estimation of significance of joint spike events seem to be inadequate.

Keywords: ISI; Poisson process; coincidence distribution; joint spike events; renewal process; synchrony.


Figures

Figure 1
Figure 1
(A–C) Raster plots for 50 trials of mutually independent spike trains generated from the Poisson, log-normal, and C-log-normal processes, respectively. Spike rate for all spike trains are chosen to be R = 50Hz and CV = 1.
Figure 2
Figure 2
(A–C) Solid distribution shows the ISI distribution of the C-log-normal process for different pairs of α and γ. The red curve illustrates the ISI distribution of the log-normal process. For all distributions CV = 1, R = 50Hz.
Figure 3
Figure 3
Eight spike rasters, each has 50 mutually independent spike trains generated from C-log-normal process for different pairs of γ and α. For all distributions CV = 1, R = 50Hz. (A1–A4) correspond to γ < 0 and (B1–B4) correspond to γ > 0.
Figure 4
Figure 4
Analytical E[ZnZnk] (Equation 26) for the same pairs of γ and α used in Figure 3. (A1–A4) correspond to γ < 0 and (B1–B4) correspond to γ > 0.
Figure 5
Figure 5
Analytical E[ZnZnk] (Equation 26) for different values of parameters (α, γ). (A1–A3) Correspond to k = 1, k = 2, and k = 3, respectively. Red crosses indicate the values of α which are the solutions of E[ZnZnk] = 0 for γ = −0.7 and γ = −0.7.
Figure 6
Figure 6
Effects of parameters α and γ on the ISI serial correlation of the C-log-normal process. The first column corresponds to α < α1, the second column corresponds to α1 < α < α2, and the third column corresponds to α > α2, where α1 and α2 are the solutions for E[ZnZnk] = 0 for a given parameter γ (CV = 1, R = 50Hz). (A1–A6) correspond to γ = −0.7 and different α. (B1–B6) correspond to γ = −0.85 and different α.
Figure 7
Figure 7
Effects of parameters α and γ on the ISI serial correlation of the C-log-normal process. The first column corresponds to α < α1, the second column corresponds to α1 < α < α2, and the third column corresponds to α > α2, where α1 and α2 are the solutions for E[ZnZnk] = 0 for a given parameter γ (CV = 1, R = 50Hz). (A1–A6) correspond to γ = 0.85 and different α. (B1–B6) correspond to γ = 0.99 and different α.
Figure 8
Figure 8
Coincidence count distribution for the spike trains generated from the C-log-normal process with the parameters γ = 0.99 and α = [0.95, 0.99, 1, 1.05], indicated by the blue histogram. The red profile indicates coincidence count distribution of the Poisson process. The red and green vertical lines show the critical numbers of coincidences that correspond to 1% significance level under the assumption that the underlying spike trains are generated from the Poisson and C-log-normal processes, respectively (CV = 1, R = 50Hz). (A–D) correspond to γ = 0.99 and different α.
Figure 9
Figure 9
Coincidence count distribution for the spike trains generated from the C-log-normal process with the parameters γ = 0.99 and α = [0.95, 0.99, 1, 1.05], indicated by the blue histogram. The red profile indicates the coincidence count distribution of the log-normal process. The red and green vertical lines show the critical numbers of coincidences that correspond to1% significance level under the assumption that the underlying spike trains are generated from the the log-normal and C-log-normal processes, respectively (CV = 1, R = 50Hz). (A–D) correspond to γ = 0.99 and different α.
Figure 10
Figure 10
False positive rate of the coincidence count distribution of the C-log-normal process based on the critical number of coincidences that corresponds to 1% significance level under the assumption that the underlying spike trains are from the Poisson process. (A1–A3) correspond to positive γs and (B1–B3) correspond to negative γs (CV = 1, R = 50Hz).
Figure 11
Figure 11
False positive rate of the coincidence count distribution of the C-log-normal process based on the critical number of coincidences that corresponds to 1% significance level under the assumption that the underlying spike trains are from the log-normal process. (A1–A3) correspond to positive γs and (B1–B3) correspond to negative γs (CV = 1, R = 50Hz).
Figure 12
Figure 12
Quantile-Quantile (QQ) plots of the coincidence count distribution of the Poisson and C-log-normal processes (CV = 1, R = 50Hz). (A1–A3) correspond to γ > 0 and different α. (B1–B3) correspond to γ < 0 and different α.
Figure 13
Figure 13
Quantile-Quantile (QQ) plots of the coincidence count distribution of the log-normal and C-log-normal processes (CV = 1, R = 50Hz). (A1–A3) correspond to γ > 0 and different α. (B1–B3) correspond to γ < 0 and different α.

References

    1. Aertsen A. M., Gerstein G. L., Habib M. K., Palm G. (1989). Dynamics of neuronal firing correlation: modulation of “effective connectivity.” J. Neurophysiol. 61, 900–917. - PubMed
    1. Burns B. D., Webb A. (1976). The spontaneous activity of neurones in the cat's cerebral cortex. Proc. R. Soc. Lond. B Biol. Sci. 194, 211–223. - PubMed
    1. Farkhooi F., Strube-Bloss M. F., Nawrot M. P. (2009). Serial correlation in neural spike trains: experimental evidence, stochastic modeling, and single neuron variability. Phys. Rev. E 79:021905. 10.1103/PhysRevE.79.021905 - DOI - PubMed
    1. Gray C. M., König P., Engel A. K., Singer W. (1989). Oscillatory responses in cat visual cortex exhibit inter-columnar synchronization which reflects global stimulus properties. Nature 338, 334–337. - PubMed
    1. Gray C. M., Singer W. (1989). Stimulus-specific neuronal oscillations in orientation columns of cat visual cortex. Proc. Natl. Acad. Sci. U.S.A. 86, 1698–1702. - PMC - PubMed

LinkOut - more resources