

Spatiotemporal Mapping of Interictal Spike Propagation: A Novel Methodology Applied to Pediatric Intracranial EEG Recordings
- PMID: 28066315
- PMCID: PMC5165024
- DOI: 10.3389/fneur.2016.00229
Spatiotemporal Mapping of Interictal Spike Propagation: A Novel Methodology Applied to Pediatric Intracranial EEG Recordings
Abstract
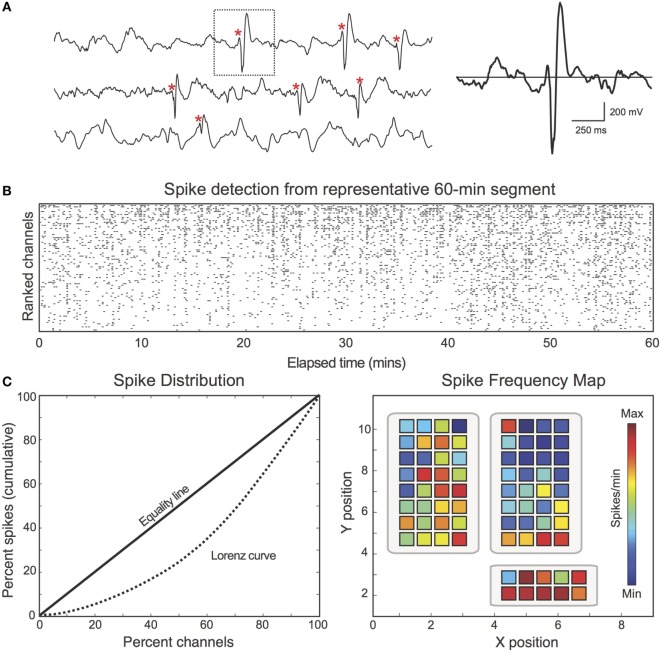
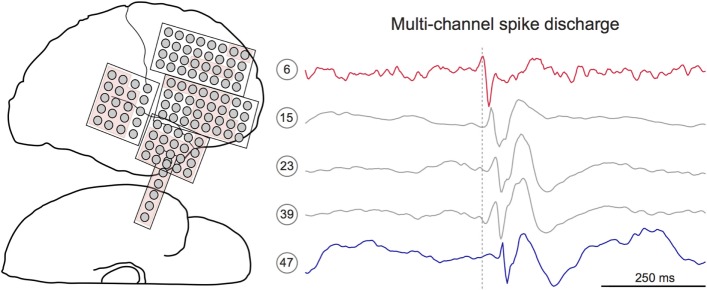
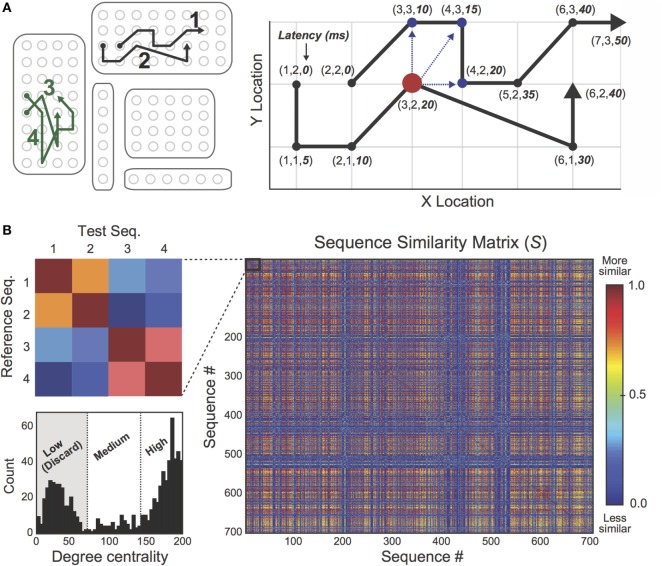
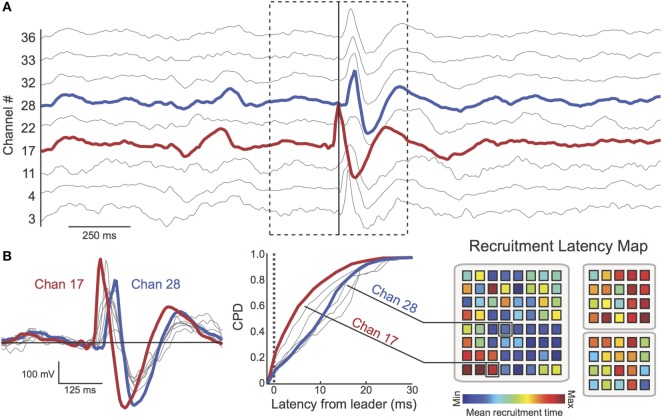
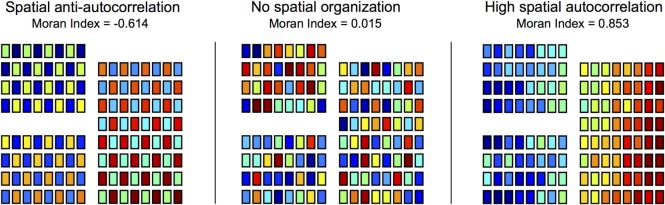
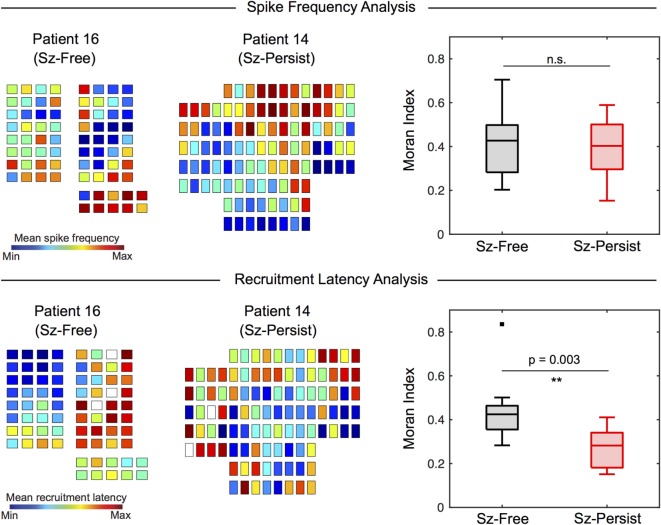
Synchronized cortical activity is implicated in both normative cognitive functioning and many neurologic disorders. For epilepsy patients with intractable seizures, irregular synchronization within the epileptogenic zone (EZ) is believed to provide the network substrate through which seizures initiate and propagate. Mapping the EZ prior to epilepsy surgery is critical for detecting seizure networks in order to achieve postsurgical seizure control. However, automated techniques for characterizing epileptic networks have yet to gain traction in the clinical setting. Recent advances in signal processing and spike detection have made it possible to examine the spatiotemporal propagation of interictal spike discharges across the epileptic cortex. In this study, we present a novel methodology for detecting, extracting, and visualizing spike propagation and demonstrate its potential utility as a biomarker for the EZ. Eighteen presurgical intracranial EEG recordings were obtained from pediatric patients ultimately experiencing favorable (i.e., seizure-free, n = 9) or unfavorable (i.e., seizure-persistent, n = 9) surgical outcomes. Novel algorithms were applied to extract multichannel spike discharges and visualize their spatiotemporal propagation. Quantitative analysis of spike propagation was performed using trajectory clustering and spatial autocorrelation techniques. Comparison of interictal propagation patterns revealed an increase in trajectory organization (i.e., spatial autocorrelation) among Sz-Free patients compared with Sz-Persist patients. The pathophysiological basis and clinical implications of these findings are considered.
Keywords: epilepsy surgery; epileptogenic zone; interictal spike propagation; pediatric epilepsy; surgical outcome.
Figures
Similar articles
-
It's All About the Networks.Epilepsy Curr. 2019 May-Jun;19(3):165-167. doi: 10.1177/1535759719843301. Epub 2019 Apr 29. Epilepsy Curr. 2019. PMID: 31032667 Free PMC article.
-
Centre of epileptogenic tubers generate and propagate seizures in tuberous sclerosis.Brain. 2016 Oct;139(Pt 10):2653-2667. doi: 10.1093/brain/aww192. Epub 2016 Aug 6. Brain. 2016. PMID: 27497492
-
Spike propagation mapping reveals effective connectivity and predicts surgical outcome in epilepsy.Brain. 2023 Sep 1;146(9):3898-3912. doi: 10.1093/brain/awad118. Brain. 2023. PMID: 37018068 Free PMC article.
-
Interictal sleep recordings during presurgical evaluation: Bidirectional perspectives on sleep related network functioning.Rev Neurol (Paris). 2022 Sep;178(7):703-713. doi: 10.1016/j.neurol.2022.03.011. Epub 2022 May 30. Rev Neurol (Paris). 2022. PMID: 35654611 Review.
-
Focal epilepsies and focal disorders.Handb Clin Neurol. 2019;161:17-43. doi: 10.1016/B978-0-444-64142-7.00039-4. Handb Clin Neurol. 2019. PMID: 31307599 Review.
Cited by
-
Interictal discharges in the human brain are travelling waves arising from an epileptogenic source.Brain. 2023 May 2;146(5):1903-1915. doi: 10.1093/brain/awad015. Brain. 2023. PMID: 36729683 Free PMC article.
-
Identifying sources of human interictal discharges with travelling wave and white matter propagation.Brain. 2023 Dec 1;146(12):5168-5181. doi: 10.1093/brain/awad259. Brain. 2023. PMID: 37527460 Free PMC article.
-
The spatial relationship between the MRI lesion and intraoperative electrocorticography in focal epilepsy surgery.Brain Commun. 2022 Nov 21;4(6):fcac302. doi: 10.1093/braincomms/fcac302. eCollection 2022. Brain Commun. 2022. PMID: 36519154 Free PMC article.
-
Reproducibility of interictal spike propagation in children with refractory epilepsy.Epilepsia. 2019 May;60(5):898-910. doi: 10.1111/epi.14720. Epub 2019 Apr 21. Epilepsia. 2019. PMID: 31006860 Free PMC article.
-
Co-activation of interictal epileptiform discharges localizes seizure onset zone and fluctuates with brain state.Brain Commun. 2025 Apr 3;7(2):fcaf127. doi: 10.1093/braincomms/fcaf127. eCollection 2025. Brain Commun. 2025. PMID: 40212342 Free PMC article.
References
-
- Schulze-Bonhage A. Epilepsy: The Intersection of Neurosciences, Biology, Mathematics, Engineering, and Physics. Boca Raton, FL: CRC Press; (2011).
Grants and funding
LinkOut - more resources
Full Text Sources
Other Literature Sources