. 2016 Dec 23:7:238.
doi: 10.3389/fneur.2016.00238. eCollection 2016.

A Review of the Segmental Diameter of the Healthy Human Spinal Cord

Affiliations

A Review of the Segmental Diameter of the Healthy Human Spinal Cord

Arvid Frostell et al. Front Neurol. .

Abstract

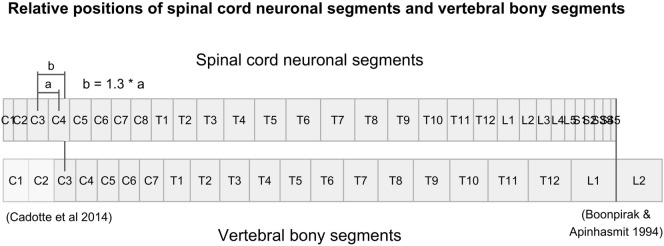
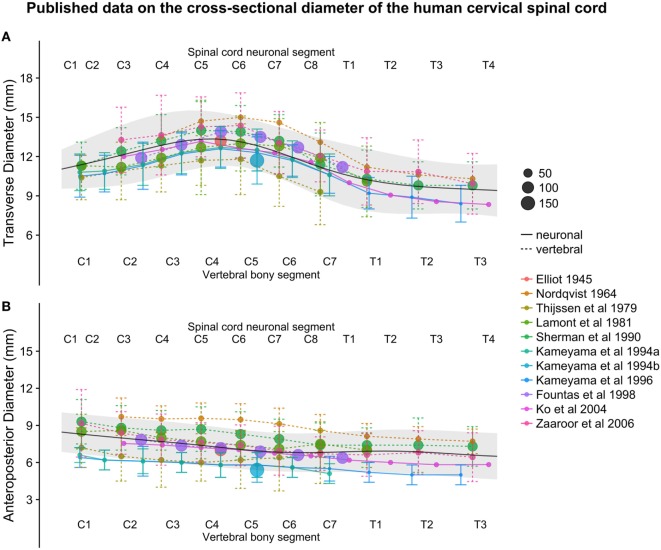
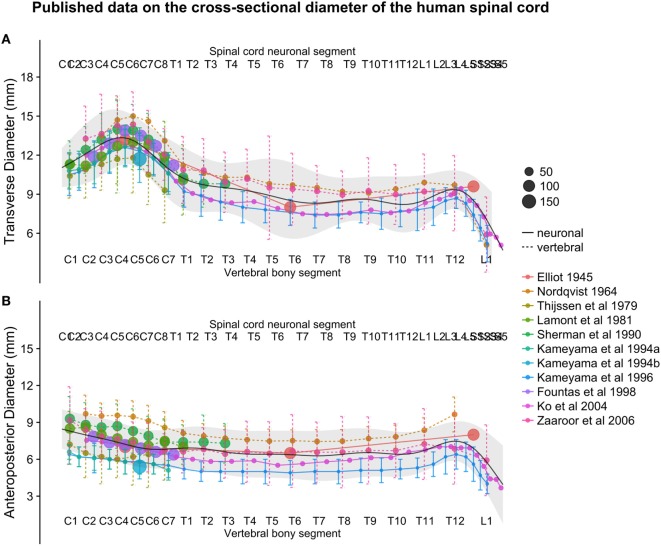
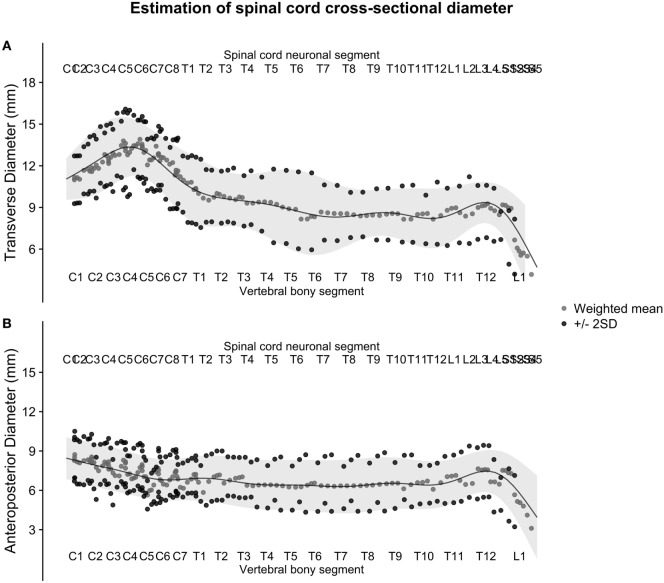
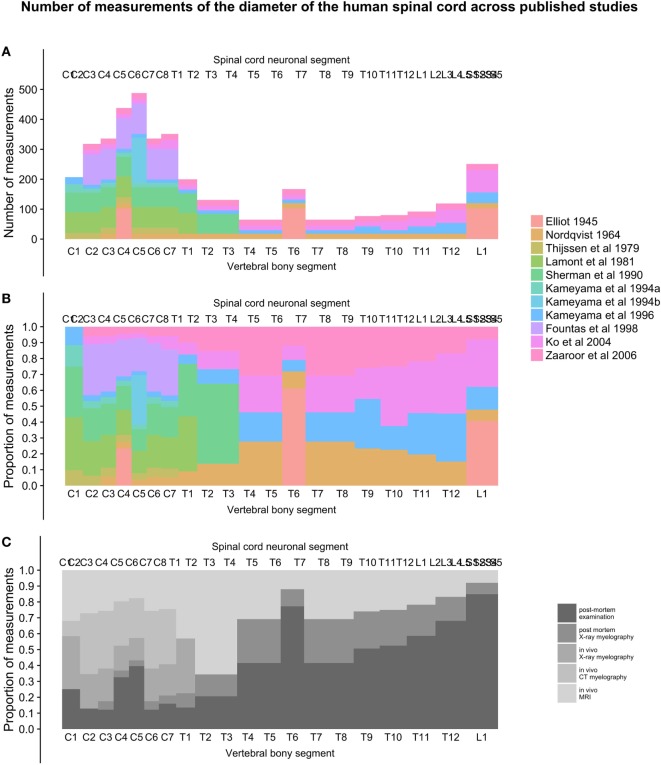
Knowledge of the average size and variability of the human spinal cord can be of importance when treating pathological conditions in the spinal cord. Data on healthy human spinal cord morphometrics have been published for more than a century using different techniques of measurements, but unfortunately, comparison of results from different studies is difficult because of the different anatomical landmarks used as reference points along the craniocaudal axis for the measurements. The aim of this review was to compute population estimates of the transverse and anteroposterior diameter of the human spinal cord by comparing and combining previously published data on a normalized craniocaudal axis. We included 11 studies presenting measurements of spinal cord cross-sectional diameters, with a combined sample size ranging from 15 to 488 subjects, depending on spinal cord level. Based on five published studies presenting data on the lengths of the segments of the spinal cord and vertebral column, we calculated the relative positions of all spinal cord neuronal segments and vertebral bony segments and mapped measurements of spinal cord size to a normalized craniocaudal axis. This mapping resulted in better alignment between studies and allowed the calculation of weighted averages and standard deviations (SDs) along the spinal cord. These weighted averages were smoothed using a generalized additive model to yield continuous population estimates for transverse and anteroposterior diameter and associated SDs. The spinal cord had the largest transverse diameter at spinal cord neuronal segment C5 (13.3 ± 2.2), decreased to segment T8 (8.3 ± 2.1), and increased slightly again to 9.4 ± 1.5 at L3. The anteroposterior diameter showed less variation in size along the spinal cord at C5 (7.4 ± 1.6), T8 (6.3 ± 2.0), and L3 (7.5 ± 1.6). All estimates are presented in millimeters ± 2 SDs. We conclude that segmental transverse and anteroposterior diameters of the healthy human spinal cord from different published sources can be combined on a normalized craniocaudal axis and yield meaningful population estimates. These estimates could be useful in routine management of patients with neurodegenerative diseases as well as for clinical research and experimental applications aimed at surgical spinal cord repair.

Keywords: morphometry; neuronal segment; reference point conversion; segmental diameter; spinal cord; vertebral segment.


Figures

Figure 1
Figure 1
Figure illustrates the relative positions of each neuronal spinal cord segment and vertebral bony segment in the human spine. Relative positions were calculated using data from Tables 3 and 4, together with relative positions of the C3-vertebral and C3-neuronal segment (10) and the mean spinal cord termination in the spinal canal at L1/L2 (11).
Figure 2
Figure 2
(A,B): with the relative positions of spinal cord neuronal segments and vertebral bony segments illustrated in Figure 1, we plotted measurements of the transverse diameter of the cervical spinal cord. In panel (A), the measurement of the transverse diameter of the spinal cord is not corrected for craniocaudal position, and, therefore, the cervical intumescence is misaligned between studies with different reference points. In panel (B) (corrected for craniocaudal position), the intumescence appears aligned. The difference in alignment was tested by fitting a second degree polynomial regression to the data points. Bootstrapping confidence intervals for the two estimates of R2 (for corrected and uncorrected, respectively) showed that the confidence intervals were non-overlapping, indicating a substantial improvement of alignment after correction.
Figure 3
Figure 3
(A,B): figure illustrates measurements of the human cervical spinal cord transverse [panel (A)] and anteroposterior diameter [panel (B)] from different published studies. The size of the dots represents the number of subjects included in each study. The full black line shows the continuous population estimate from the general additive model, and the gray ribbon represents the population estimate ± 2 standard deviations (SDs) (based on the SDs of the studies).
Figure 4
Figure 4
(A,B): figure illustrates measurements of the human spinal cord transverse [panel (A)] and anteroposterior diameter [panel (B)] from different published studies. The size of the dots represents the number of subjects included in each study. The full black line shows the continuous population estimate from the general additive model, and the gray ribbon represents the population estimate ± 2 standard deviations (SDs) (based on the SDs of the studies).
Figure 5
Figure 5
(A,B): figure illustrates the weighted averages of the human spinal cord transverse [panel (A)] and anteroposterior diameter [panel (B)] from different published studies. The full black line shows the continuous population estimate from the general additive model, and the gray ribbon shows two standard deviations (SDs) from the population estimate based on the SDs of the studies.
Figure 6
Figure 6
(A–C): figure demonstrates the total number of individual measurements contributed from each study at different points along the craniocaudal axis [panel (A)] and the proportional contribution of studies [panel (B)] and methods [panel (C)] used to measure the diameters of the human spinal cord.

References

    1. Kearney H, Miller DH, Ciccarelli O. Spinal cord MRI in multiple sclerosis – diagnostic, prognostic and clinical value. Nat Rev Neurol (2015) 11(6):327–38.10.1038/nrneurol.2015.80 - DOI - PubMed
    1. Ahuja CS, Fehlings M. Concise review: bridging the gap: novel neuroregenerative and neuroprotective strategies in spinal cord injury. Stem Cells Transl Med (2016) 5(7):914–24.10.5966/sctm.2015-0381 - DOI - PMC - PubMed
    1. McDonald JW, Sadowsky C. Spinal-cord injury. Lancet (2002) 359(9304):417–25.10.1016/S0140-6736(02)07603-1 - DOI - PubMed
    1. Sherman JL, Nassaux PY, Citrin CM. Measurements of the normal cervical spinal cord on MR imaging. AJNR Am J Neuroradiol (1990) 11(2):369–72. - PMC - PubMed
    1. Zaaroor M, Kósa G, Peri-Eran A, Maharil I, Shoham M, Goldsher D. Morphological study of the spinal canal content for subarachnoid endoscopy. Minim Invasive Neurosurg (2006) 49(4):220–6.10.1055/s-2006-948000 - DOI - PubMed