

Responses of Aspergillus flavus to Oxidative Stress Are Related to Fungal Development Regulator, Antioxidant Enzyme, and Secondary Metabolite Biosynthetic Gene Expression
- PMID: 28066369
- PMCID: PMC5175028
- DOI: 10.3389/fmicb.2016.02048
Responses of Aspergillus flavus to Oxidative Stress Are Related to Fungal Development Regulator, Antioxidant Enzyme, and Secondary Metabolite Biosynthetic Gene Expression
Abstract
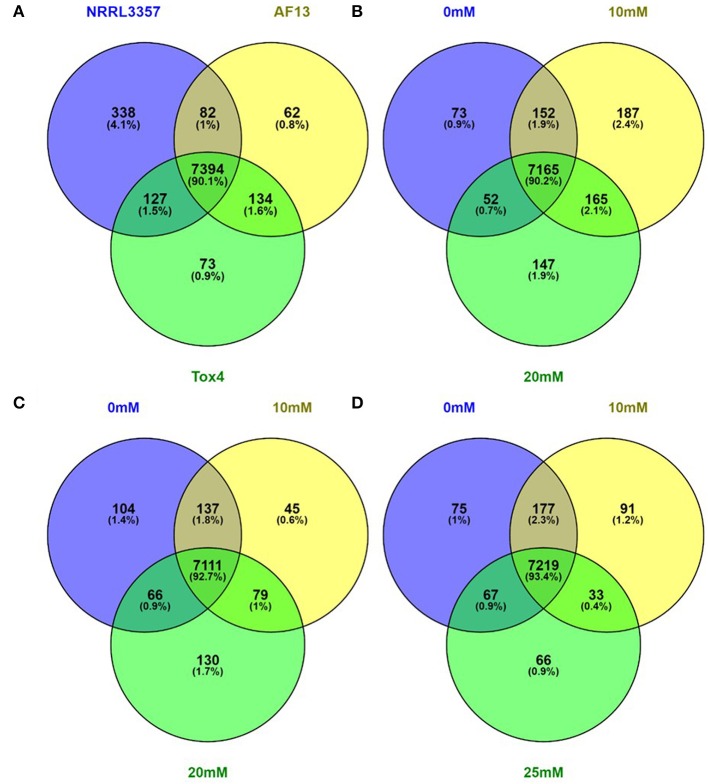
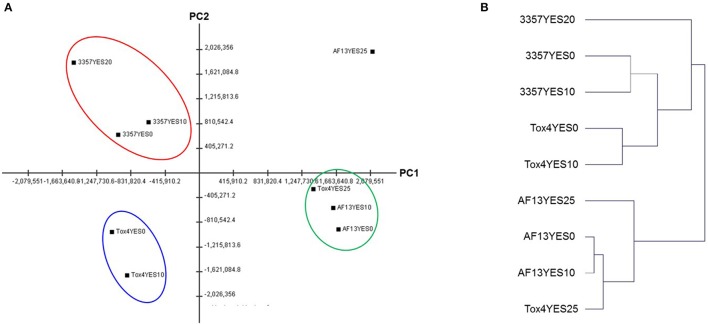
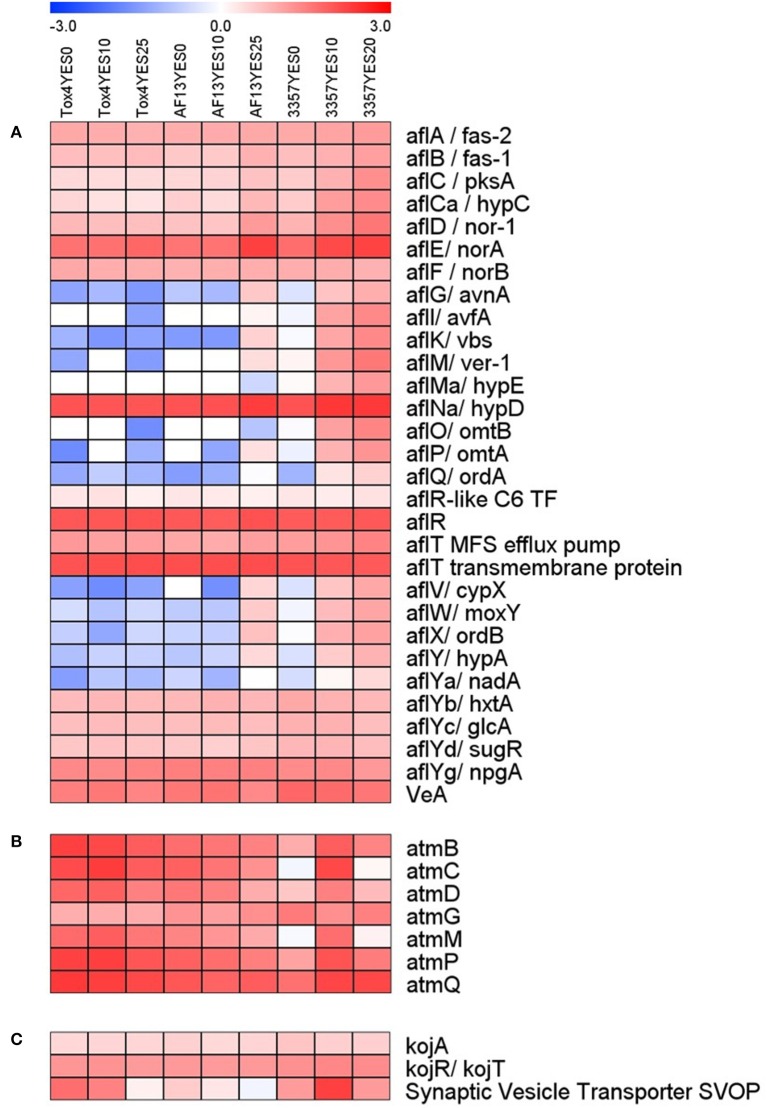
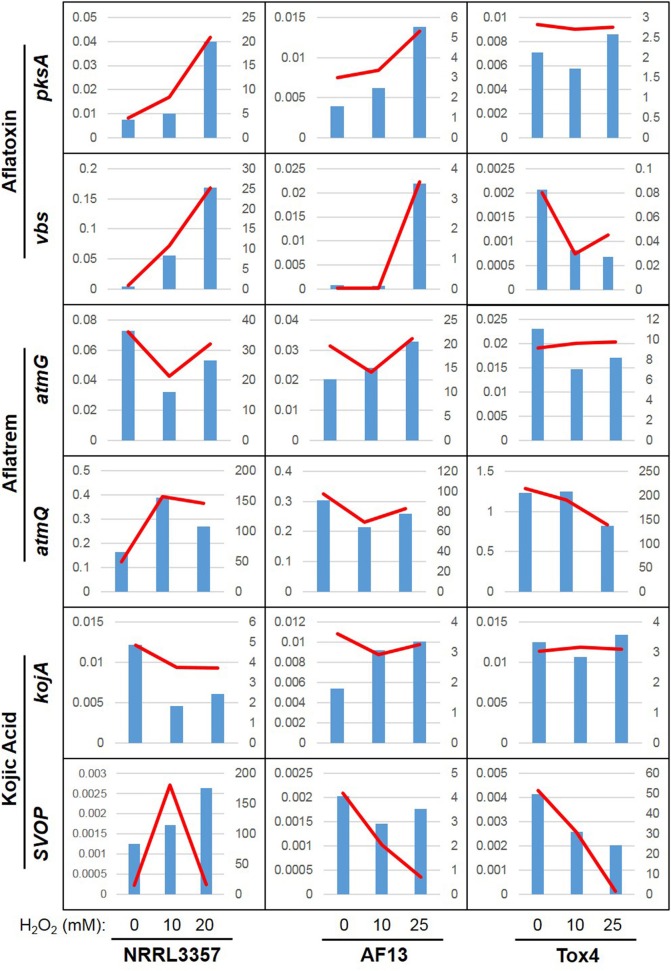
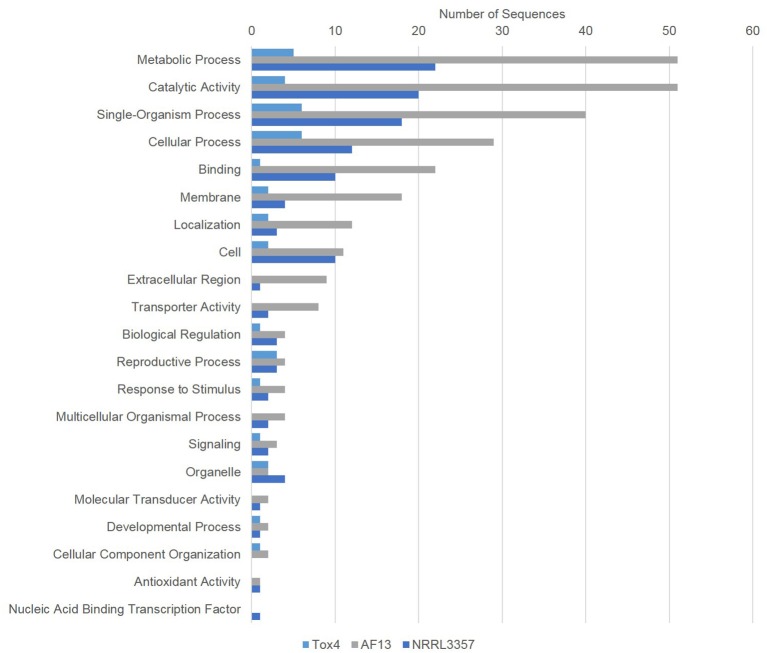
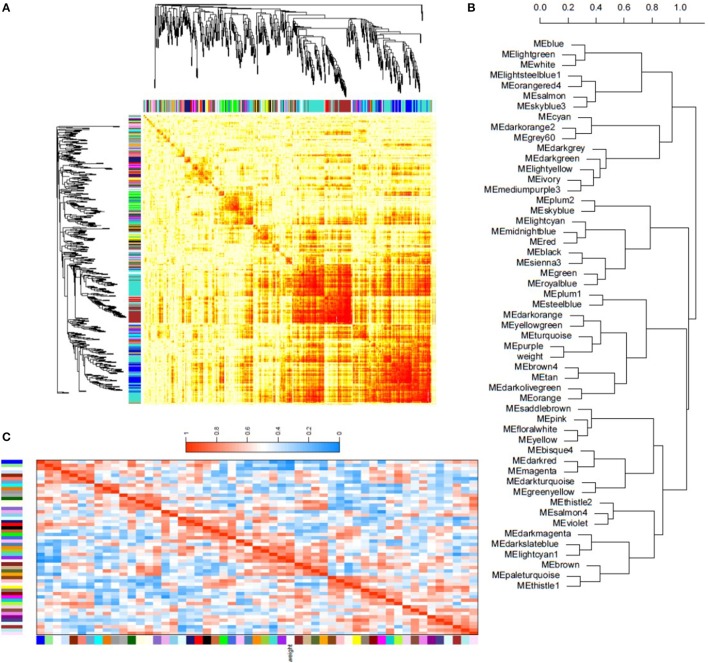
The infection of maize and peanut with Aspergillus flavus and subsequent contamination with aflatoxin pose a threat to global food safety and human health, and is exacerbated by drought stress. Drought stress-responding compounds such as reactive oxygen species (ROS) are associated with fungal stress responsive signaling and secondary metabolite production, and can stimulate the production of aflatoxin by A. flavus in vitro. These secondary metabolites have been shown to possess diverse functions in soil-borne fungi including antibiosis, competitive inhibition of other microbes, and abiotic stress alleviation. Previously, we observed that isolates of A. flavus showed differences in oxidative stress tolerance which correlated with their aflatoxin production capabilities. In order to better understand these isolate-specific oxidative stress responses, we examined the transcriptional responses of field isolates of A. flavus with varying levels of aflatoxin production (NRRL3357, AF13, and Tox4) to H2O2-induced oxidative stress using an RNA sequencing approach. These isolates were cultured in an aflatoxin-production conducive medium amended with various levels of H2O2. Whole transcriptomes were sequenced using an Illumina HiSeq platform with an average of 40.43 million filtered paired-end reads generated for each sample. The obtained transcriptomes were then used for differential expression, gene ontology, pathway, and co-expression analyses. Isolates which produced higher levels of aflatoxin tended to exhibit fewer differentially expressed genes than isolates with lower levels of production. Genes found to be differentially expressed in response to increasing oxidative stress included antioxidant enzymes, primary metabolism components, antibiosis-related genes, and secondary metabolite biosynthetic components specifically for aflatoxin, aflatrem, and kojic acid. The expression of fungal development-related genes including aminobenzoate degradation genes and conidiation regulators were found to be regulated in response to increasing stress. Aflatoxin biosynthetic genes and antioxidant enzyme genes were also found to be co-expressed and highly correlated with fungal biomass under stress. This suggests that these secondary metabolites may be produced as part of coordinated oxidative stress responses in A. flavus along with antioxidant enzyme gene expression and developmental regulation.
Keywords: Aspergillus flavus; aflatoxin; aflatrem; kojic acid; oxidative stress.
Figures
Similar articles
-
Carbohydrate, glutathione, and polyamine metabolism are central to Aspergillus flavus oxidative stress responses over time.BMC Microbiol. 2019 Sep 5;19(1):209. doi: 10.1186/s12866-019-1580-x. BMC Microbiol. 2019. PMID: 31488075 Free PMC article.
-
Oxidative stress and carbon metabolism influence Aspergillus flavus transcriptome composition and secondary metabolite production.Sci Rep. 2016 Dec 12;6:38747. doi: 10.1038/srep38747. Sci Rep. 2016. PMID: 27941917 Free PMC article.
-
Proteome analysis of Aspergillus flavus isolate-specific responses to oxidative stress in relationship to aflatoxin production capability.Sci Rep. 2018 Feb 21;8(1):3430. doi: 10.1038/s41598-018-21653-x. Sci Rep. 2018. PMID: 29467403 Free PMC article.
-
Understanding the genetics of regulation of aflatoxin production and Aspergillus flavus development.Mycopathologia. 2006 Sep;162(3):155-66. doi: 10.1007/s11046-006-0050-9. Mycopathologia. 2006. PMID: 16944283 Review.
-
Genetic organization and function of the aflatoxin B1 biosynthetic genes.FEMS Microbiol Lett. 1998 Mar 15;160(2):169-76. doi: 10.1111/j.1574-6968.1998.tb12907.x. FEMS Microbiol Lett. 1998. PMID: 9532734 Review.
Cited by
-
Flavonoids Modulate Aspergillus flavus Proliferation and Aflatoxin Production.J Fungi (Basel). 2022 Nov 16;8(11):1211. doi: 10.3390/jof8111211. J Fungi (Basel). 2022. PMID: 36422032 Free PMC article.
-
Global Transcriptome Profiling Identified Transcription Factors, Biological Process, and Associated Pathways for Pre-Harvest Aflatoxin Contamination in Groundnut.J Fungi (Basel). 2021 May 26;7(6):413. doi: 10.3390/jof7060413. J Fungi (Basel). 2021. PMID: 34073230 Free PMC article.
-
Catalases in the pathogenesis of Sporothrix schenckii research.PeerJ. 2022 Dec 7;10:e14478. doi: 10.7717/peerj.14478. eCollection 2022. PeerJ. 2022. PMID: 36523453 Free PMC article. Review.
-
The Kinetochore Protein Spc105, a Novel Interaction Partner of LaeA, Regulates Development and Secondary Metabolism in Aspergillus flavus.Front Microbiol. 2019 Aug 13;10:1881. doi: 10.3389/fmicb.2019.01881. eCollection 2019. Front Microbiol. 2019. PMID: 31456789 Free PMC article.
-
Surviving the odds: From perception to survival of fungal phytopathogens under host-generated oxidative burst.Plant Commun. 2021 Jan 4;2(3):100142. doi: 10.1016/j.xplc.2021.100142. eCollection 2021 May 10. Plant Commun. 2021. PMID: 34027389 Free PMC article. Review.
References
-
- Andrade P. D., Caldas E. D. (2015). Aflatoxins in cereals: worldwide occurrence and dietary risk assessment. World Mycotoxin J. 8, 415–431. 10.3920/WMJ2014.1847 - DOI
LinkOut - more resources
Full Text Sources
Other Literature Sources