

Fine Spatial Scale Variation of Soil Microbial Communities under European Beech and Norway Spruce
- PMID: 28066384
- PMCID: PMC5177625
- DOI: 10.3389/fmicb.2016.02067
Fine Spatial Scale Variation of Soil Microbial Communities under European Beech and Norway Spruce
Abstract
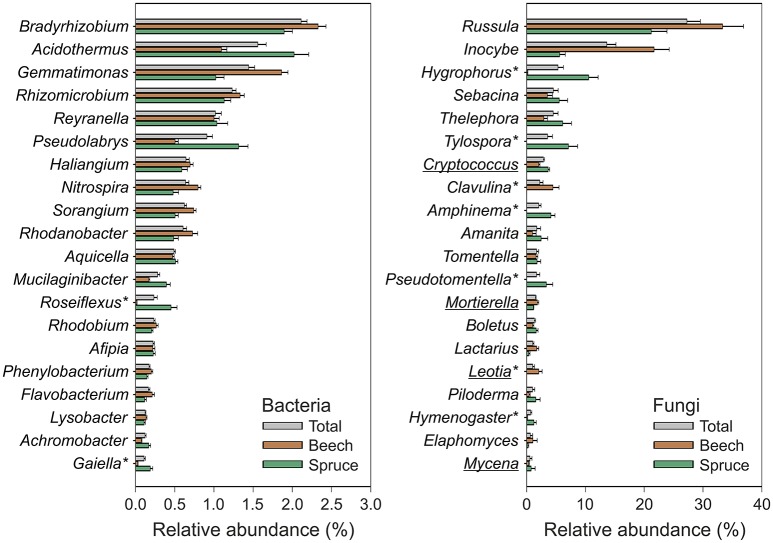
The complex interactions between trees and soil microbes in forests as well as their inherent seasonal and spatial variations are poorly understood. In this study, we analyzed the effects of major European tree species (Fagus sylvatica L. and Picea abies (L.) Karst) on soil bacterial and fungal communities. Mineral soil samples were collected from different depths (0-10, 10-20 cm) and at different horizontal distances from beech or spruce trunks (0.5, 1.5, 2.5, 3.5 m) in early summer and autumn. We assessed the composition of soil bacterial and fungal communities based on 16S rRNA gene and ITS DNA sequences. Community composition of bacteria and fungi was most strongly affected by soil pH and tree species. Different ectomycorrhizal fungi (e.g., Tylospora) known to establish mutualistic associations with plant roots showed a tree species preference. Moreover, bacterial and fungal community composition showed spatial and seasonal shifts in soil surrounding beech and spruce. The relative abundance of saprotrophic fungi was higher at a depth of 0-10 vs. 10-20 cm depth. This was presumably a result of changes in nutrient availability, as litter input and organic carbon content decreased with soil depth. Overall bacterial community composition showed strong variations under spruce with increasing distance from the tree trunks, which might be attributed in part to higher fine root biomass near spruce trunks. Furthermore, overall bacterial community composition was strongly affected by season under deciduous trees.
Keywords: bacterial 16S rRNA gene; fungal ITS DNA; horizontal distance from tree trunk; seasons; soil depth; soil microbial community structure; soil properties; tree species.
Figures


Similar articles
-
Deep Soil Layers of Drought-Exposed Forests Harbor Poorly Known Bacterial and Fungal Communities.Front Microbiol. 2021 May 7;12:674160. doi: 10.3389/fmicb.2021.674160. eCollection 2021. Front Microbiol. 2021. PMID: 34025630 Free PMC article.
-
Quantitative losses vs. qualitative stability of ectomycorrhizal community responses to 3 years of experimental summer drought in a beech-spruce forest.Glob Chang Biol. 2018 Feb;24(2):e560-e576. doi: 10.1111/gcb.13957. Epub 2017 Nov 15. Glob Chang Biol. 2018. PMID: 29063659
-
Microbial community structure and density under different tree species in an acid forest soil (Morvan, France).Microb Ecol. 2005 Nov;50(4):614-25. doi: 10.1007/s00248-005-5130-8. Epub 2005 Dec 13. Microb Ecol. 2005. PMID: 16333717
-
Shift in tree species changes the belowground biota of boreal forests.New Phytol. 2022 Jun;234(6):2073-2087. doi: 10.1111/nph.18109. Epub 2022 Apr 10. New Phytol. 2022. PMID: 35307841 Free PMC article.
-
Specific impacts of beech and Norway spruce on the structure and diversity of the rhizosphere and soil microbial communities.Sci Rep. 2016 Jun 15;6:27756. doi: 10.1038/srep27756. Sci Rep. 2016. PMID: 27302652 Free PMC article.
Cited by
-
The grazing activity of Acrobeloides sp. drives phytate mineralisation within its trophic relationship with bacteria.J Nematol. 2021 Feb 25;53:e2021-21. doi: 10.21307/jofnem-2021-021. eCollection 2021. J Nematol. 2021. PMID: 33860247 Free PMC article.
-
GlobalFungi, a global database of fungal occurrences from high-throughput-sequencing metabarcoding studies.Sci Data. 2020 Jul 13;7(1):228. doi: 10.1038/s41597-020-0567-7. Sci Data. 2020. PMID: 32661237 Free PMC article.
-
Nonferrous metal (loid) s mediate bacterial diversity in an abandoned mine tailing impoundment.Environ Sci Pollut Res Int. 2019 Aug;26(24):24806-24818. doi: 10.1007/s11356-019-05092-3. Epub 2019 Jun 25. Environ Sci Pollut Res Int. 2019. PMID: 31240654
-
Year-round dynamics of arbuscular mycorrhizal fungi communities in the roots and surrounding soils of Cryptomeria japonica.Mycorrhiza. 2024 Apr;34(1-2):119-130. doi: 10.1007/s00572-024-01143-x. Epub 2024 Mar 20. Mycorrhiza. 2024. PMID: 38509266 Free PMC article.
-
Current Insight into Traditional and Modern Methods in Fungal Diversity Estimates.J Fungi (Basel). 2022 Feb 24;8(3):226. doi: 10.3390/jof8030226. J Fungi (Basel). 2022. PMID: 35330228 Free PMC article. Review.
References
-
- Augusto L., Ranger J., Binkley D., Rothe A. (2002). Impact of several common tree species of European temperate forests on soil fertility. Ann. For. Sci. 59, 233–253. 10.1051/forest:2002020 - DOI
LinkOut - more resources
Full Text Sources
Other Literature Sources