. 2016 Dec 19:7:593.
doi: 10.3389/fimmu.2016.00593. eCollection 2016.

Implications of Intravital Imaging of Murine Germinal Centers on the Control of B Cell Selection and Division

Affiliations

Implications of Intravital Imaging of Murine Germinal Centers on the Control of B Cell Selection and Division

Sebastian C Binder et al. Front Immunol. .

Abstract

Intravital imaging of antibody optimization in germinal center (GC) reactions has set a new dimension in the understanding of the humoral immune response during the last decade. The inclusion of spatio-temporal cellular dynamics in the research on GCs required analysis using the agent-based mathematical models. In this study, we integrate the available intravital imaging data from various research groups and incorporate these into a quantitative mathematical model of GC reactions and antibody affinity maturation. Interestingly, the integration of data concerning the spatial organization of GCs and B cell motility allows to draw conclusions on the strength of the selection pressure and the control of B cell division by T follicular helper cells.

Keywords: B cell motility; T follicular helper cells; affinity maturation; antibody optimization; chemotaxis; dark and light zone; germinal center.


Figures

Figure 1
Figure 1
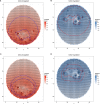
Chemokine distributions and de-/resensitization. Figures show the chemokine gradient in a two-dimensional cutsection through a germinal center. Gradient directions are indicated by the arrows in the vector field plots, its magnitude is shown by the color. Lines indicate the positions at which chemotaxis desensitization (inner border) and resensitization (outer border) occur.
Figure 2
Figure 2
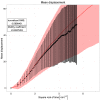
Mean displacement versus square root of time. Dots and error bars indicate the mean displacement and SD of tracked cells as measured in experiment (6). The red line and shaded area show mean displacement and SD of tracked cells in 20 simulations. The cell position is tracked every 20 s both in silico and in experiment.
Figure 3
Figure 3
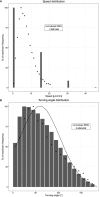
Speed and turning angle distributions of B cells. Dots indicate experimental measurements, and bars show the mean of 20 simulations. (A) Distribution of observed speeds expressed as percent of maximum frequency. (B) Distribution of observed turning angles expressed as percent of maximum frequency. The distribution indicated by the solid line shows the mean of 20 simulations without chemotaxis. Cells are tracked every 20 s both in silico and in experiment.
Figure 4
Figure 4
Transzone migration as measured by tracking photoactivated cells in silico. Photoactivation is performed in a defined region in either of the two zones and subsequent migration of the photoactivated cells is tracked. Displayed data show the fraction of photoactivated cells that appear in the opposite zone. Dots and error bars indicate means and SD from experimental measurements (8), lines and shaded area show mean and SD from 20 simulations. (A) Transzone migration with reference chemotaxis sensitivity parameters (see Figure 1); (B) transzone migration in simulations with alternative parameters for chemotaxis (see Figures 5C,D).
Figure 5
Figure 5
Different chemokine distributions that lead to reduced asymmetry in the transzone migration in silico. Figures show the chemokine gradient in a two-dimensional cutsection through a germinal center. Gradient directions are indicated by the arrows in the vector field plots, its magnitude is shown by the color. Lines indicate the positions at which desensitization (inner border) and resensitization (outer border) occur. (A,B) Chemotaxis with resensitizations at lower concentrations compared to the reference simulation; (C,D) chemotaxis with desensitization at the concentration at the zone boundary and resensitization at a 30% lower concentration.
Figure 6
Figure 6
Ratio of B cells in the dark zone to those in the light zone after injection of αDEC205-OVA. Dots indicate experimental measurements (8), lines and shaded area show mean and SD from 20 simulations. The two colors show the reaction of DEC205+/+ and DEC205−/− cells. DEC205−/− are not subjected to stimulation by αDEC205-OVA and can, thus, be expected to represent the behavior in the absence of strong antigenic stimulation. (A) DZ to LZ ratio in reference simulations with DND; (B) DZ to LZ ratio in simulations without DND.

References

    1. MacLennan ICM. Germinal centers. Annu Rev Immunol (1994) 12:117–39.10.1146/annurev.iy.12.040194.001001 - DOI - PubMed
    1. Victora G, Nussenzweig M. Germinal centers. Annu Rev Immunol (2012) 30:429–57.10.1146/annurev-immunol-020711-075032 - DOI - PubMed
    1. Berek C, Milstein C. Mutation drift and repertoire shift in the maturation of the immune response. Immunol Rev (1987) 96:23–41.10.1111/j.1600-065X.1987.tb00507.x - DOI - PubMed
    1. Kosco-Vilbois MH. Are follicular dendritic cells really good for nothing? Nat Rev Immunol (2003) 3:764–9.10.1038/nri1179 - DOI - PubMed
    1. Szakal A, Kosco M, Tew J. A novel in vivo follicular dendritic cell-dependent iccosome-mediated mechanism for delivery of antigen to antigen-processing cells. J Immunol (1988) 140:341–53. - PubMed

LinkOut - more resources