. 2015 Sep;9(3):1226-1246.
doi: 10.1214/15-AOAS841. Epub 2015 Nov 2.

QUANTILE REGRESSION FOR MIXED MODELS WITH AN APPLICATION TO EXAMINE BLOOD PRESSURE TRENDS IN CHINA

Affiliations

QUANTILE REGRESSION FOR MIXED MODELS WITH AN APPLICATION TO EXAMINE BLOOD PRESSURE TRENDS IN CHINA

Luke B Smith et al. Ann Appl Stat. 2015 Sep.

Abstract

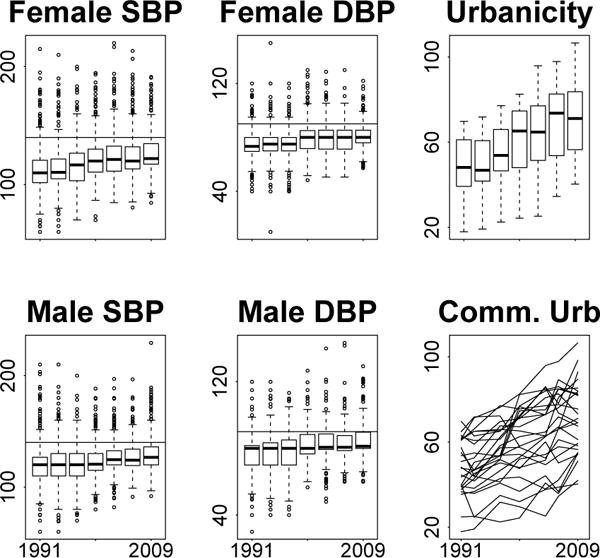
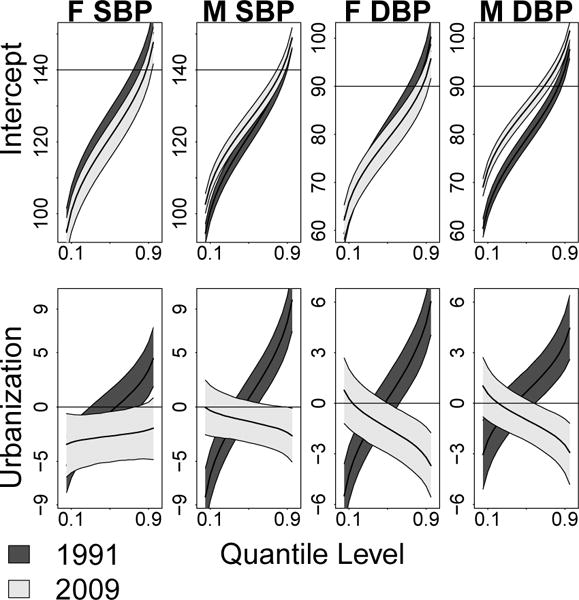
Cardiometabolic diseases have substantially increased in China in the past 20 years and blood pressure is a primary modifiable risk factor. Using data from the China Health and Nutrition Survey we examine blood pressure trends in China from 1991 to 2009, with a concentration on age cohorts and urbanicity. Very large values of blood pressure are of interest, so we model the conditional quantile functions of systolic and diastolic blood pressure. This allows the covariate effects in the middle of the distribution to vary from those in the upper tail, the focal point of our analysis. We join the distributions of systolic and diastolic blood pressure using a copula, which permits the relationships between the covariates and the two responses to share information and enables probabilistic statements about systolic and diastolic blood pressure jointly. Our copula maintains the marginal distributions of the group quantile effects while accounting for within-subject dependence, enabling inference at the population and subject levels. Our population level regression effects change across quantile level, year, and blood pressure type, providing a rich environment for inference. To our knowledge, this is the first quantile function model to explicitly model within-subject autocorrelation and is the first quantile function approach that simultaneously models multivariate conditional response. We find that the association between high blood pressure and living in an urban area has evolved from positive to negative, with the strongest changes occurring in the upper tail. The increase in urbanization over the last twenty years coupled with the transition from the positive association between urbanization and blood pressure in earlier years to a more uniform association with urbanization suggests increasing blood pressure over time throughout China, even in less urbanized areas. Our methods are available in the R package BSquare.

Keywords: Bayesian; Quantile regression; blood pressure; longitudinal; multivariate.


Figures

Fig 1
Fig 1
Systolic blood pressure (SBP) and diastolic blood pressure (DBP) by gender and urbanicity scores across time. Blood pressure measurements are in millimeters of mercury (mmHg). Urbanicity is a composite score measuring 12 features of the community environment (Jones-Smith and Popkin, 2010). Horizontal lines represent thresholds for high blood pressure, located at 140 mmHg and 90 mmHg for systolic and diastolic blood pressure respectively.
Fig 2
Fig 2
Plots of the quantile model with M = 5 basis functions with knots at (0.25, 0.5, 0.75) and one covariate x, with θ.1 = (0, 3, 3, 3, 3) corresponding to basis coefficients for the intercept and θ.2 = (0, 0, 2, −2, −2) corresponding to basis coefficients for x. The left plot displays the constant basis function (m = 1) and 4 Gaussian basis functions that each correspond to a different quartile of the distribution. The middle plot displays the intercept process β1(τ), which is the distribution when all covariates are 0, and the covariate effect β2(τ), defined as the deviation in the intercept process due to a one unit change in x. The final panel displays the conditional quantile function Q(τ|x) = β1(τ) + xβ2(τ) for x = −1, x = 0, and x = 1.
Fig 3
Fig 3
Plots of posterior credible sets of urbanicity random effects on females for systolic blood pressure. For visual clarity posterior credible sets are ordered by posterior median and every 10th subject is shown.
Fig 4
Fig 4
Plots of the intercept process for the age 40–50 cohort and population urbanicity effects by gender and blood pressure type. The intercept process is the distribution of the response when all covariates are 0. The urbanicity plots are the effects of a one standard deviation increase in urbanicity on the τth quantile of blood pressure. Dark regions correspond to 1991 estimates, while light regions correspond to 2009 estimates.

References

    1. Adair L, Gordon-Larsen P, Du S, Zhang B, Popkin B. The emergence of cardiometabolic disease risk in Chinese children and adults: consequences of changes in diet, physical activity and obesity. Obesity Reviews. 2014;15:49–59. - PMC - PubMed
    1. Attard SM, Herring AH, Zhang B, Du S, Popkin BM, Gordon-Larsen P. Associations between age, cohort, and urbanization with SBP and DBP in China: a population-based study across 18 years. Hypertension 2015 - PMC - PubMed
    1. Batis C, Gordon-Larsen P, Cole SR, Du S, Zhang B, Popkin B. Sodium intake from various time frames and incident hypertension among Chinese adults. Epidemiology. 2013;24:410–418. - PMC - PubMed
    1. Benetos A, Thomas F, Safar ME, Bean KE, Guize L. Should diastolic and systolic blood pressure be considered for cardiovascular risk evaluation: a study in middle-aged men and women. Journal of the American College of Cardiology. 2001;37:163–168. - PubMed
    1. Bondell HD, Reich BJ, Wang H. Noncrossing quantile regression curve estimation. Biometrika. 2010;97:825–838. - PMC - PubMed

LinkOut - more resources