. 2016 Dec 20:6:191.
doi: 10.3389/fcimb.2016.00191. eCollection 2016.

Functional Intestinal Bile Acid 7α-Dehydroxylation by Clostridium scindens Associated with Protection from Clostridium difficile Infection in a Gnotobiotic Mouse Model

Affiliations

Functional Intestinal Bile Acid 7α-Dehydroxylation by Clostridium scindens Associated with Protection from Clostridium difficile Infection in a Gnotobiotic Mouse Model

Nicolas Studer et al. Front Cell Infect Microbiol. .

Abstract

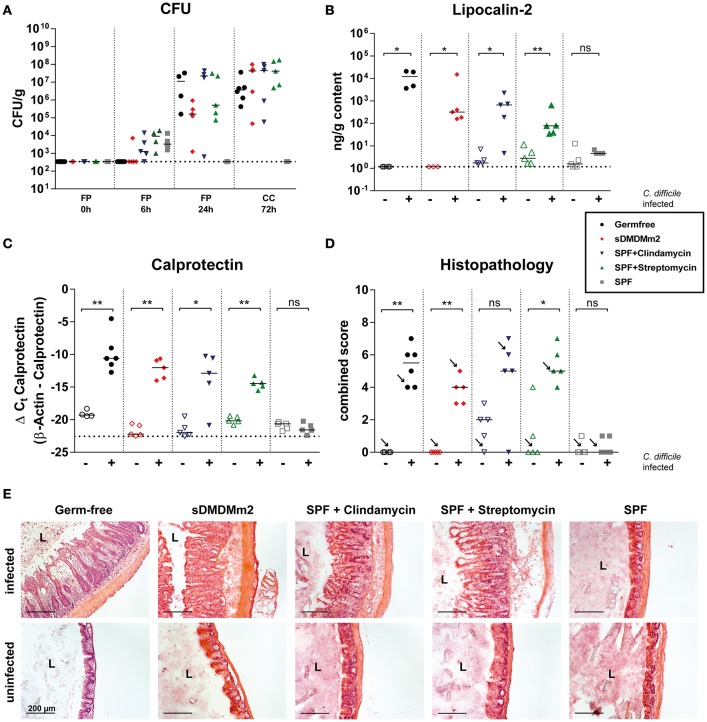
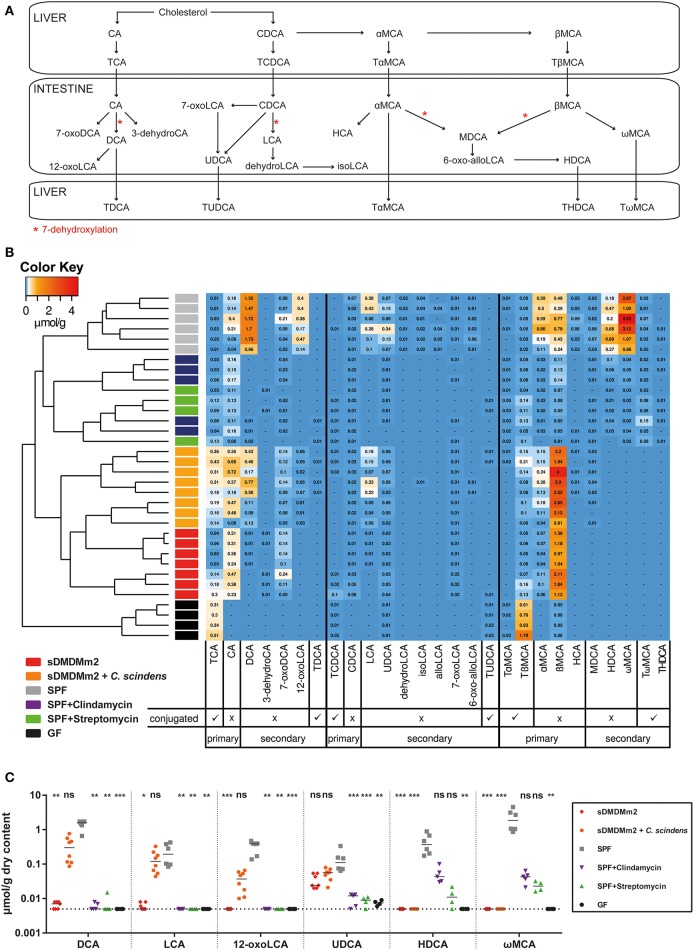
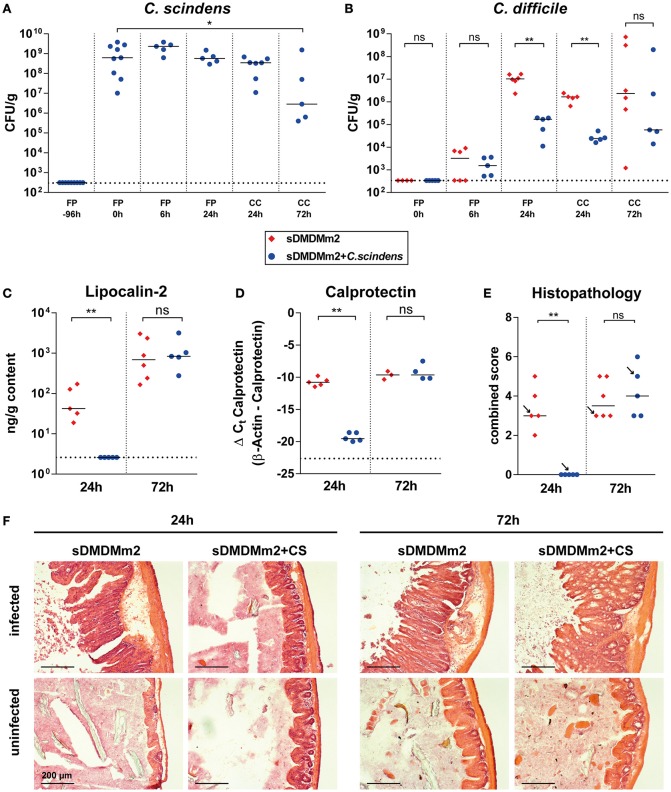
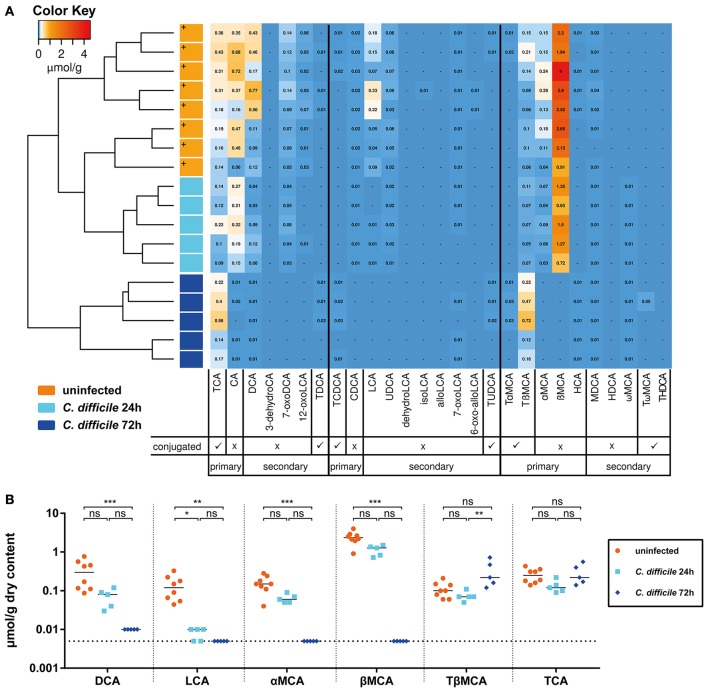
Bile acids, important mediators of lipid absorption, also act as hormone-like regulators and as antimicrobial molecules. In all these functions their potency is modulated by a variety of chemical modifications catalyzed by bacteria of the healthy gut microbiota, generating a complex variety of secondary bile acids. Intestinal commensal organisms are well-adapted to normal concentrations of bile acids in the gut. In contrast, physiological concentrations of the various intestinal bile acid species play an important role in the resistance to intestinal colonization by pathogens such as Clostridium difficile. Antibiotic therapy can perturb the gut microbiota and thereby impair the production of protective secondary bile acids. The most important bile acid transformation is 7α-dehydroxylation, producing deoxycholic acid (DCA) and lithocholic acid (LCA). The enzymatic pathway carrying out 7α-dehydroxylation is restricted to a narrow phylogenetic group of commensal bacteria, the best-characterized of which is Clostridium scindens. Like many other intestinal commensal species, 7-dehydroxylating bacteria are understudied in vivo. Conventional animals contain variable and uncharacterized indigenous 7α-dehydroxylating organisms that cannot be selectively removed, making controlled colonization with a specific strain in the context of an undisturbed microbiota unfeasible. In the present study, we used a recently established, standardized gnotobiotic mouse model that is stably associated with a simplified murine 12-species "oligo-mouse microbiota" (Oligo-MM12). It is representative of the major murine intestinal bacterial phyla, but is deficient for 7α-dehydroxylation. We find that the Oligo-MM12 consortium carries out bile acid deconjugation, a prerequisite for 7α-dehydroxylation, and confers no resistance to C. difficile infection (CDI). Amendment of Oligo-MM12 with C. scindens normalized the large intestinal bile acid composition by reconstituting 7α-dehydroxylation. These changes had only minor effects on the composition of the native Oligo-MM12, but significantly decreased early large intestinal C. difficile colonization and pathogenesis. The delayed pathogenesis of C. difficile in C. scindens-colonized mice was associated with breakdown of cecal microbial bile acid transformation.

Keywords: 7α-dehydroxylation; Clostridium difficile; Clostridium difficile infection (CDI); Clostridium scindens; gnotobiotic mouse model; gut microbiota; intestinal infection; secondary bile acids.


Figures

Figure 1
Figure 1
Infections with C. difficile in sDMDMm2 mice resemble infections in antibiotic-treated mice. Cohorts of germ-free (black circles, n = 6), sDMDMm2 (red diamonds, n = 5), clindamycin-treated SPF (purple inverted triangles, n = 5), streptomycin-treated SPF (green triangles, n = 5), and SPF control (gray squares, n = 5) mice were gavaged with 103 CFU C. difficile DH1916 (filled symbols) or PBS vehicle as control (open symbols). (A) Comparison of CFU of C. difficile in fecal pellets (FP) or cecal contents (CC) at different time points over course of infection. (B) Comparison of lipocalin-2 measured by ELISA in cecal content after 72 h of infection. (C) Comparison of calprotectin from cecal tissue after 72 h of infection measured by qPCR. Values show the ΔCt derived from measured values of calprotectin with β-actin as control. (D) Histopathological evaluation of H&E stained sections of cecum tissue at time of necropsy (72 h). Arrows indicate the representative mice depicted in (E). (E) Representative images of H&E stained sections of cecum tissue at time of necropsy (72 h). L, Lumen; Scale bars: 200 μm. Statistical analyses in (B–D) used Mann-Whitney-U tests to compare uninfected with infected animals at individual timepoints. Each symbol represents one individual. Bars indicate medians. Dotted lines indicate lower limit of detection. ns, not statistically significant (p ≥ 0.05); *p < 0.05; **p < 0.01.
Figure 2
Figure 2
Pre-colonization with C. scindens partially restores a SPF-like bile acid profile. SPF mice were pre-treated with streptomycin (n = 4) or clindamycin (n = 5) 24 h before sacrifice; sDMDMm2 mice pre-colonized 7 days before sacrifice with C. scindens (n = 8), unmanipulated SPF (n = 6), sDMDMm2 (n = 7), and germ-free (n = 4) animals were used as controls. Cecal content was aseptically removed and processed for bile acid metabolome quantification. Data was assembled from three individual experiments. (A) Schematic diagram of murine bile acid metabolism. Adapted from Zhang et al. (2012) and Song et al. (2011). (B) Heatmap analysis constructed from bile acid LC-MS/MS measurements. Values indicate measured bile acid concentrations in μmol/g dry weight of cecal content. (C) Analysis of individual secondary bile acids elevated in sDMDMm2 + C. scindens mice vs. sDMDMm2 mice. Statistical analysis used the Kruskal–Wallis test with Dunn's post-test to compare individual bile acids of the different groups against SPF. Each symbol represents one individual. Bars indicate medians. Dotted lines indicate lower limit of detection. ns, not statistically significant (p ≥ 0.05); *p < 0.05; **p < 0.01; ***p < 0.001. TCA, taurocholic acid; CA, cholic acid; DCA, deoxycholic acid; 3-dehydroCA, 3-dehydrocholic acid; 7-oxoDCA, 7-oxodeoxycholic acid; 12-oxoLCA, 12-oxolithocholic acid; TDCA, taurodeoxycholic acid; TCDCA, taurochenodeoxycholic acid; CDCA, chenodeoxycholic acid; LCA, lithocholic acid; UDCA, ursodeoxycholic acid; dehydroLCA, dehydrolithocholic acid; isoLCA, iso-lithocholic acid; alloLCA, allo-lithocholic acid; 7-oxoLCA, 7-oxolithocholic acid; TUDCA, tauroursodeoxycholic acid; TαMCA, tauro-α-muricholic acid; TβMCA, tauro-β-muricholic acid; αMCA, α-muricholic acid; βMCA, β-muricholic acid; HCA, hyocholic acid; MDCA, murodeoxycholic acid; 6-oxo-allo-LCA, 6-oxo-allo-lithocholic acid; HDCA, hyodeoxycholic acid; ωMCA, ω-muricholic acid; TωMCA, tauro-ω-muricholic acid; THDCA, taurohyodeoxycholic acid.
Figure 3
Figure 3
Addition of C. scindens to sDMDMm2 can partially protect from C. difficile infection. sDMDMm2 animals were pre-colonized by gavage with 109 CFU C. scindens 96 h before infection with 103 CFU C. difficile DH1916 (blue circles). sDMDMm2 animals (red diamonds) served as control. Data is combined from two independent experiments with endpoints at 24 h (n = 5 sDMDMm2 and n = 5 sDMDM + C. scindens, only data from endpoint shown) and 72 h (n = 6 sDMDMm2 and n = 5 sDMDM + C. scindens). (A) CFU of C. scindens over the course of the infection in pre-colonized mice. (B) Comparison of C. difficile CFU between sDMDMm2 and sDMDMm2 + C. scindens over the course of infection. Uninfected controls are not depicted. (C) Lipocalin-2 concentration measured by ELISA in cecal content at 24 and 72 h post infection, respectively. (D) Mucosal calprotectin expression in cecal tissue measured by qPCR at 24 and 72 h post infection, respectively. Values show the ΔCt derived from measured values of calprotectin with β-actin as control. (E) Histopathological evaluation of H&E stained sections of cecum tissue at time of necropsy (24 or 72 h). Uninfected controls are not depicted. Arrows indicate the representative mice depicted in (F). (F) H&E stained histological sections of cecum sampled at 24 and 72 h post infection. FP, Fecal pellet; CC, Cecal content; L, Lumen; Scale bars: 200 μm. Statistical analyses in (B–E) used Mann-Whitney-U tests; Each symbol represents one individual. Bars indicate medians. Dotted lines indicate lower limit of detection. ns, not statistically significant (p ≥ 0.05); *p < 0.05; **p < 0.01.
Figure 4
Figure 4
Infection of sDMDMm2 + C. scindens mice with C. difficile leads to decrease in secondary and deconjugated primary bile acids. Cecal contents of sDMDMm2 + C. scindens mice infected with C. difficile used in Figure 3 were used to quantify bile acid measurements. Measurements from uninfected control mice (colonized with C. scindens for 7 days) from Figure 2 were included as comparison (orange symbols, indicated by plus sign). (A) Heatmap analysis constructed from bile acid LC-MS/MS measurements. Values indicate measured bile acid concentrations in μmol/g dry weight of cecal content. (B) Analysis of individual bile acids in sDMDMm2 + C. scindens mice infected by C. difficile over time. Statistical analysis used the Kruskal-Wallis test with Dunn's post-test to compare individual bile acids between the groups. Each symbol represents one individual. Bars indicate medians. Dotted lines indicate lower limit of detection. ns, not statistically significant (p ≥ 0.05); *p < 0.05; **p < 0.01; ***p < 0.001. TCA, taurocholic acid; CA, cholic acid; DCA, deoxycholic acid; 3-dehydroCA, 3-dehydrocholic acid; 7-oxoDCA, 7-oxodeoxycholic acid; 12-oxoLCA, 12-oxolithocholic acid; TDCA, taurodeoxycholic acid; TCDCA, taurochenodeoxycholic acid; CDCA, chenodeoxycholic acid; LCA, lithocholic acid; UDCA, ursodeoxycholic acid; dehydroLCA, dehydrolithocholic acid; isoLCA, iso-lithocholic acid; alloLCA, allo-lithocholic acid; 7-oxoLCA, 7-oxolithocholic acid; TUDCA, tauroursodeoxycholic acid; TαMCA, tauro-α-muricholic acid; TβMCA, tauro-β-muricholic acid; αMCA, α-muricholic acid; βMCA, β-muricholic acid; HCA, hyocholic acid; MDCA, murodeoxycholic acid; 6-oxo-allo-LCA, 6-oxo-allo-lithocholic acid; HDCA, hyodeoxycholic acid; ωMCA, ω-muricholic acid; TωMCA, tauro-ω-muricholic acid; THDCA, taurohyodeoxycholic acid.
Figure 5
Figure 5
Addition of C. scindens leads only to small changes in the composition of the Oligo-MM12 microbiota. (A) qPCR based microbiota analysis of all 12 Oligo-MM strains as well as C. difficile and C. scindens from fecal pellets (−7 days, −4 days, 0 h, 24 h) or cecal content (72 h). Top graph: n = 5 sDMDMm2 and n = 5 sDMDMm2 + C. difficile animals. Bottom Graph: n = 3 sDMDMm2 + C. scindens (pre-colonized for 7 days) and n = 3 sDMDMm2 + C. scindens + C. difficile animals (pre-colonized for 7 days before infection of 3 days). Y-Axis is depicted as two-segment axis. (B) Non-parametric multidimensional scaling of the Oligo-MM12 microbiota data shown in (A), analyzed from fecal pellets from time points t = −7 days (before C. scindens colonization), t = −4 days, t = 0 h (before C. difficile infection), and t = 24 h (without using the qPCR data of C. difficile or C. scindens). (C) Non-parametric multidimensional scaling of the Oligo-MM12 microbiota data shown in (A), analyzed from cecal contents from timepoint t = 72 h (without using the qPCR data of C. difficile or C. scindens).

References

    1. Antunes L. C., Han J., Ferreira R. B., Lolić P., Borchers C. H., Finlay B. B. (2011). Effect of antibiotic treatment on the intestinal metabolome. Antimicrob. Agents Chemother. 55, 1494–1503. 10.1128/AAC.01664-10 - DOI - PMC - PubMed
    1. Barrasa J. I., Olmo N., Lizarbe M. A., Turnay J. (2012). Bile acids in the colon, from healthy to cytotoxic molecules. Toxicol. In Vitro 27, 964–977. 10.1016/j.tiv.2012.12.020 - DOI - PubMed
    1. Barthel M., Hapfelmeier S., Quintanilla-Martinez L., Kremer M., Rohde M., Hogardt M., et al. . (2003). Pretreatment of mice with streptomycin provides a Salmonella enterica serovar typhimurium colitis model that allows analysis of both pathogen and host. Infect. Immun. 71:2839. 10.1128/IAI.71.5.2839-2858.2003 - DOI - PMC - PubMed
    1. Begley M., Gahan C. G., Hill C. (2005). The interaction between bacteria and bile. FEMS Microbiol. Rev. 29, 625–651. 10.1016/j.femsre.2004.09.003 - DOI - PubMed
    1. Britton R. A., Young V. B. (2012). Interaction between the intestinal microbiota and host in Clostridium difficile colonization resistance. Trends Microbiol. 20, 313–319. 10.1016/j.tim.2012.04.001 - DOI - PMC - PubMed

Publication types

Substances