. 2017 Jan;3(1):82-98.
doi: 10.1016/j.jcmgh.2016.09.001.

CD36 deficiency impairs the small intestinal barrier and induces subclinical inflammation in mice

Affiliations

CD36 deficiency impairs the small intestinal barrier and induces subclinical inflammation in mice

Vincenza Cifarelli et al. Cell Mol Gastroenterol Hepatol. 2017 Jan.

Abstract

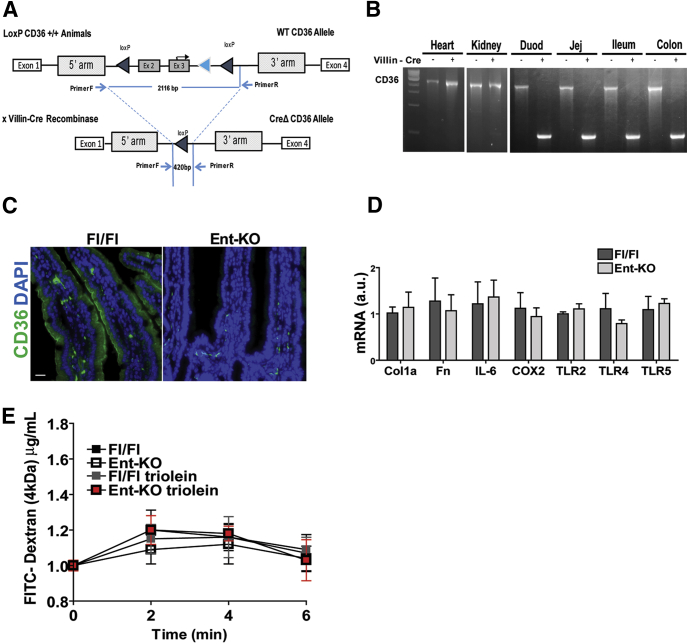
Background & aims: CD36 has immuno-metabolic actions and is abundant in the small intestine on epithelial, endothelial and immune cells. We examined the role of CD36 in gut homeostasis using mice null for CD36 (CD36KO) and with CD36 deletion specific to enterocytes (Ent-CD36KO) or endothelial cells (EC-CD36KO).

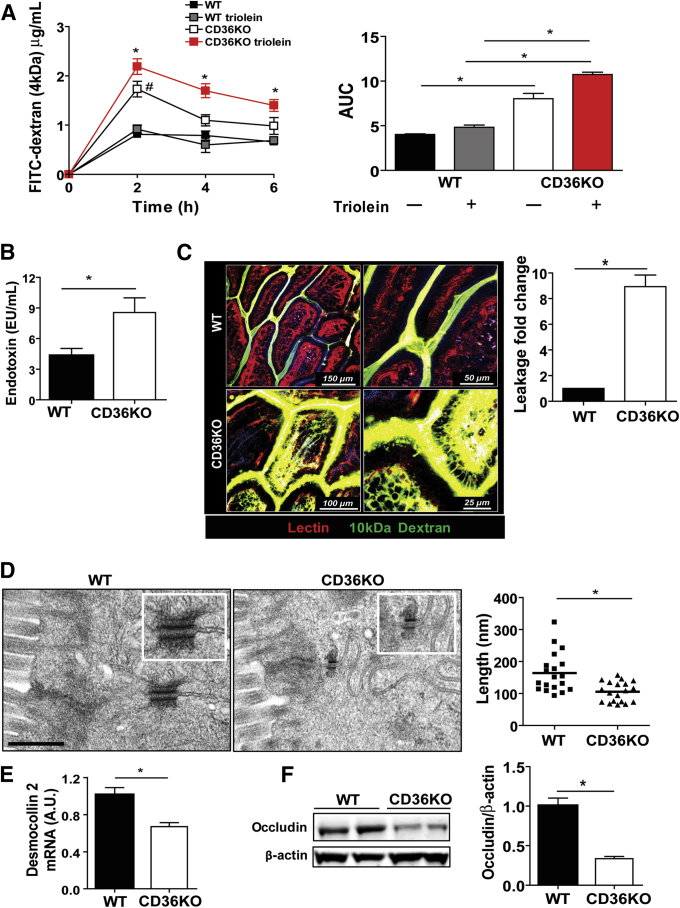
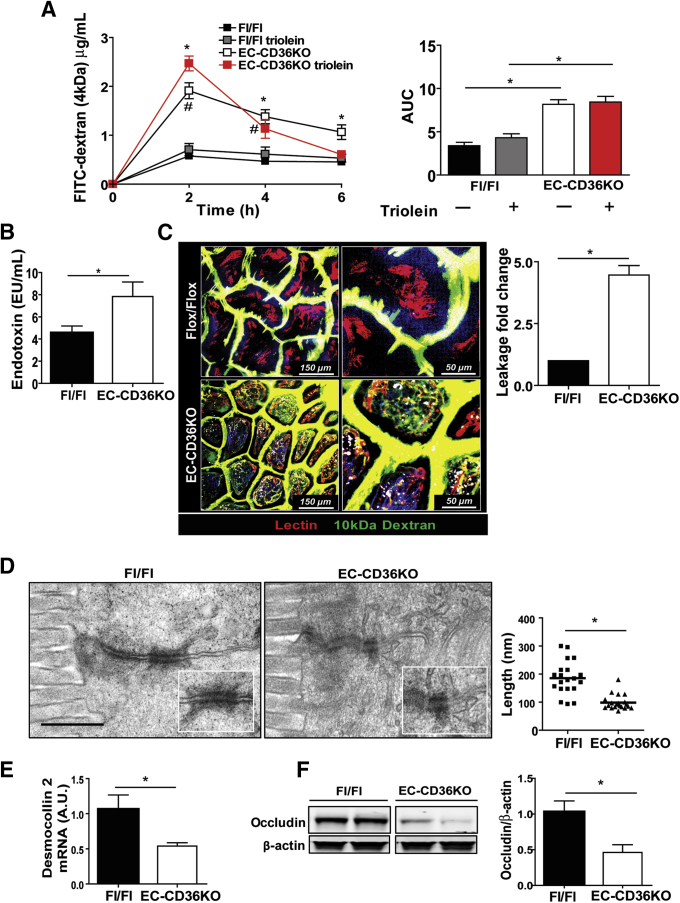
Methods: Intestinal morphology was evaluated using immunohistochemistry and electron microscopy (EM). Intestinal inflammation was determined from neutrophil infiltration and expression of cytokines, toll-like receptors and COX-2. Barrier integrity was assessed from circulating lipopolysaccharide (LPS) and dextran administered intragastrically. Epithelial permeability to luminal dextran was visualized using two photon microscopy.

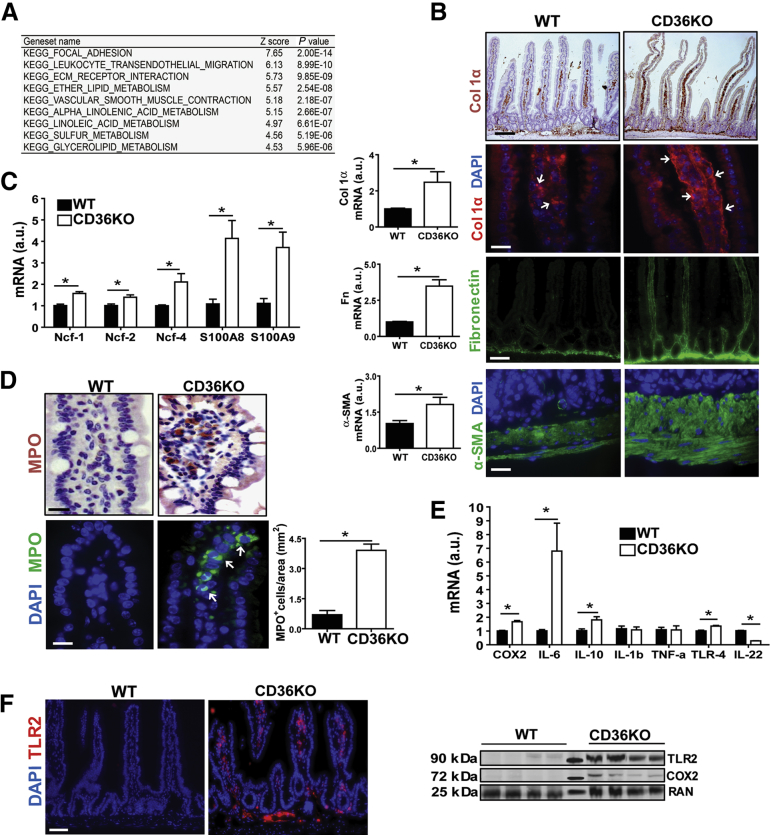
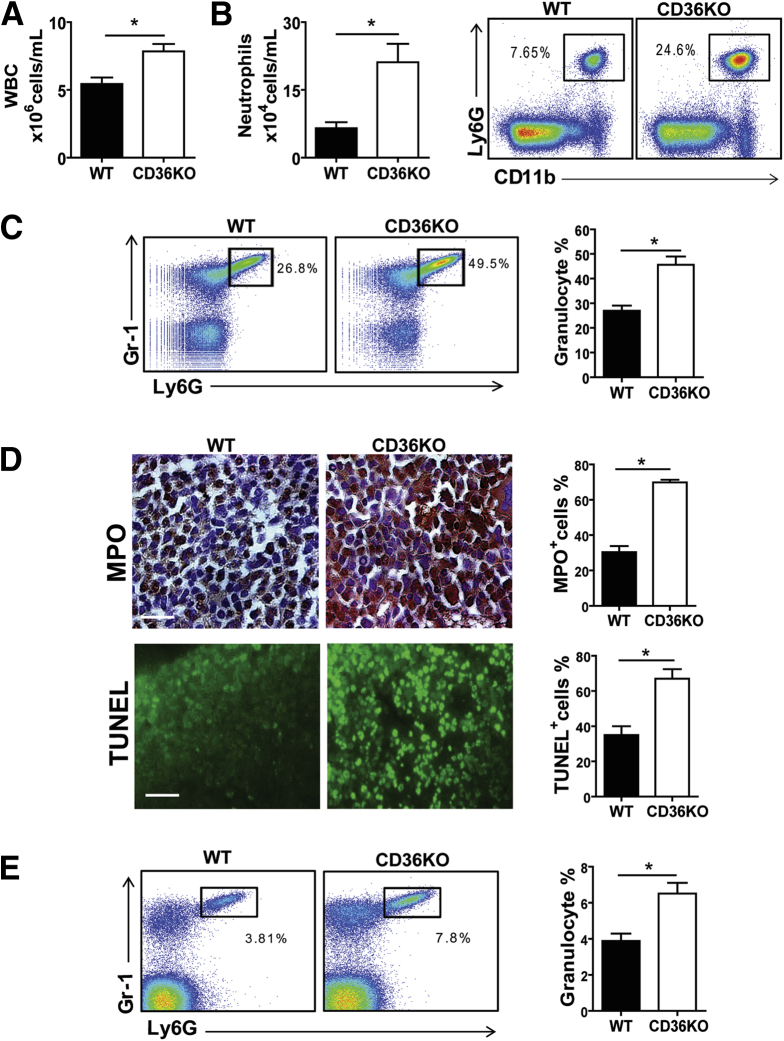
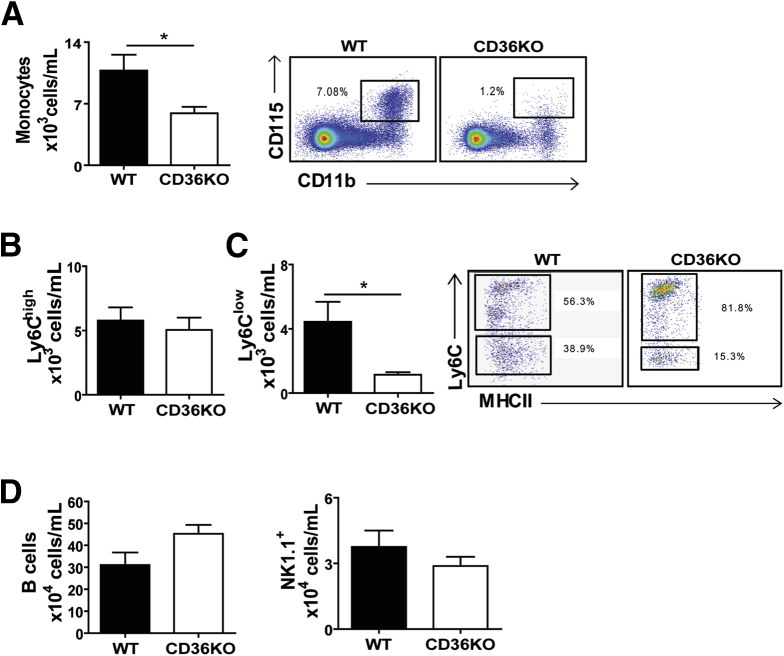
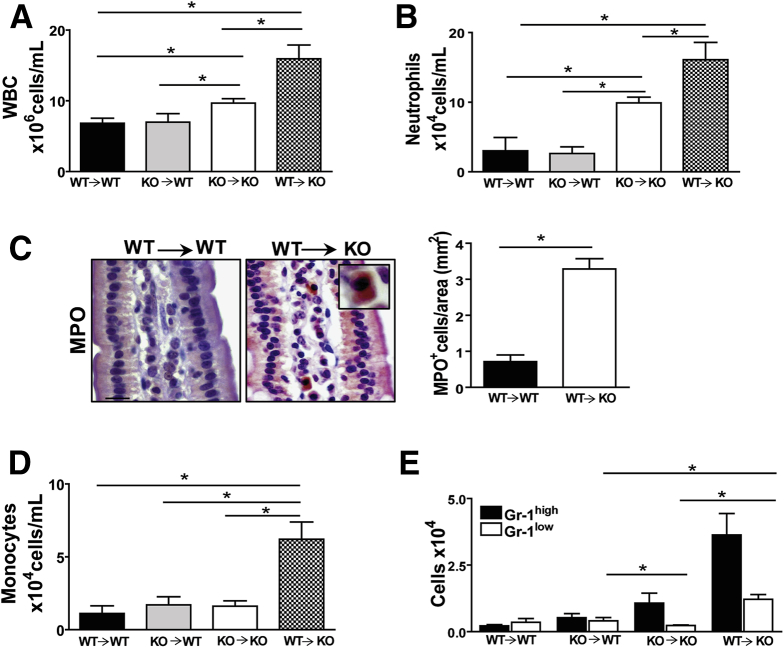
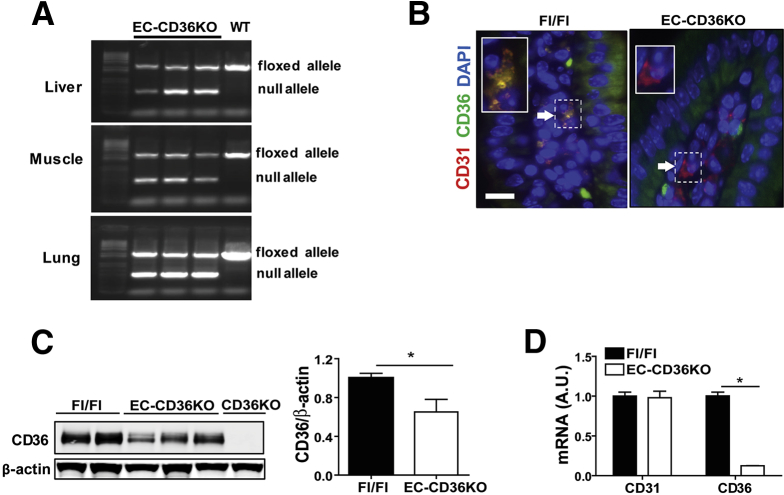
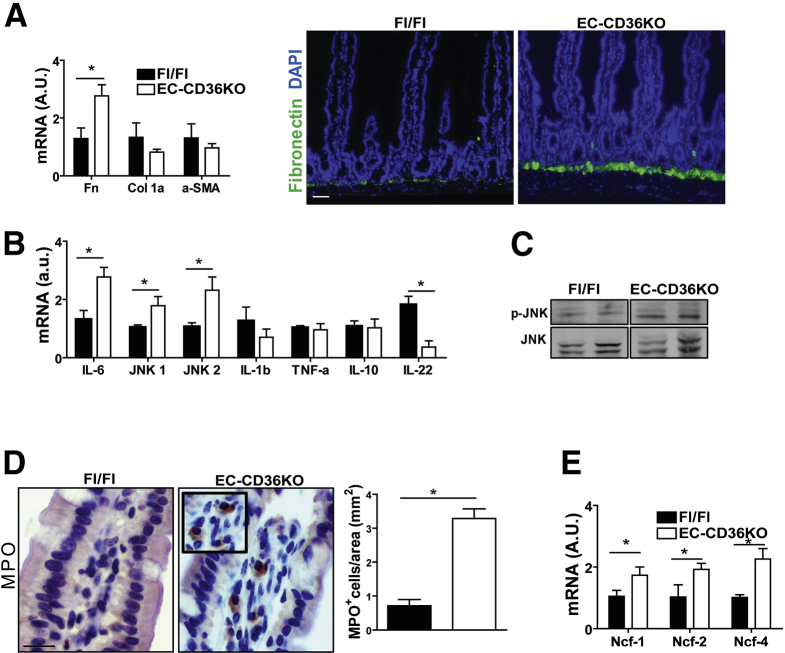
Results: The small intestines of CD36KO mice fed a chow diet showed several abnormalities including extracellular matrix (ECM) accumulation with increased expression of ECM proteins, evidence of neutrophil infiltration, inflammation and compromised barrier function. EM showed shortened desmosomes with decreased desmocollin 2 expression. Systemically, leukocytosis and neutrophilia were present together with 80% reduction of anti-inflammatory Ly6Clow monocytes. Bone marrow transplants supported the primary contribution of non-hematopoietic cells to the inflammatory phenotype. Specific deletion of endothelial but not of enterocyte CD36 reproduced many of the gut phenotypes of germline CD36KO mice including fibronectin deposition, increased interleukin 6, neutrophil infiltration, desmosome shortening and impaired epithelial barrier function.

Conclusions: CD36 loss results in chronic neutrophil infiltration of the gut, impairs barrier integrity and systemically causes subclinical inflammation. Endothelial cell CD36 deletion reproduces the major intestinal phenotypes. The findings suggest an important role of the endothelium in etiology of gut inflammation and loss of epithelial barrier integrity.

Keywords: Neutrophils; collagen; endothelium; fibronectin.


Conflict of interest statement

The authors have declared that no conflict of interest exists.

Figures

Figure 1
Figure 1
CD36 deletion causes remodeling of ECM proteins and immune cell infiltration in the small intestine. (A) Microarray analysis on proximal intestines showing the 9 most upregulated pathways in CD36KO mice as compared with controls, including those related to leukocyte transendothelial migration and ECM. (B) Altered ECM remodeling in intestines of CD36KO mice; qRT-PCR showing increased expression of ECM proteins: collagen 1α (P = .01), fibronectin (P = .0003), and α-SMA (P = .04) (n = 6/genotype; typical of 3 experiments). Immunostaining of collagen 1α, fibronectin, and α-SMA was also increased (n = 4/genotype; representative of 2 experiments). (C and D) Neutrophil infiltration of CD36KO intestines. (C) Increased expression of neutrophil cytoplasmic protein (Ncf)-1 (P = .04), Ncf-2 (P = .02), Ncf-4 (P = .03), S100A8 (P = .007), and S100A9 (P = .01) in CD36KO mice as compared with WT controls (n = 6/genotype; representative of 3 experiments) and (D) MPO immunohistochemical (top panels) and fluorescent (bottom panels) staining. Graph shows quantification of immunofluorescence (P = .01) (n = 4/genotype; representative of 2 experiments). (E and F) Altered expression of inflammatory mediators in CD36KO intestine: (E) COX-2 (P = .0006), IL6 (P = .03), IL10 (P = .028), TLR4 (P = .04), IL22 (P = .03) (n = 6/genotype; representative of 3 experiments), and (F) TLR2 immunostaining (images representative of 2 experiments, n = 4/genotype). Immunoblots show levels of COX-2 and TLR2 measured in intestinal lysates; middle lane: molecular weight markers, 25, 72, and 90 kDa. Scale bars: 25 μm for (B), lower col1α, α-SMA, and (D) 100 μm for (B), upper col1α, fibronectin, and for (F). All bar graphs show means ± standard error of the mean (SEM). *P < .05 by 2-tailed Student t test.
Figure 2
Figure 2
Gut barrier permeability is impaired in CD36KO mice. (A) Plasma level of FITC-dextran (4 kDa) measured at indicated times after its intragastric administration. A week later, same mice group received triolein bolus (4.5 μL/g body weight) 30 minutes before FITC-dextran. #WT versus CD36KO mice, *WTtriolein versus CD36KOtriolein mice. Levels in WT mice did not change with or without triolein bolus. Intestinal permeability was increased in all CD36KO mice at 2 hours (P = .04; Ptriolein = .032) and remained increased at 4 hours (P = .043) and 6 hours (P = .041) in CD36KO mice given triolein. Right panel shows area under the curve (AUC) for CD36KO and CD36KOtriolein mice was increased compared with appropriate controls (P < .001 and P = .005, respectively) and before as compared with after triolein challenge (P < .001). (B) Measurement of endotoxin in plasma of WT and CD36KO mice 4 hours after triolein challenge (n = 4/genotype), P = .03. (C) Two-photon microscopy optical sections showing leakage across the epithelium; fluorescein-dextran (10 kDa) (green) was administered intraluminally to intestines of anesthetized mice (n = 3/genotype) and DyLight 594–conjugated tomato lectin (red), a vascular marker, by retro-orbital injection 10 minutes before imaging from the luminal surface. Dextran leakage is observed in CD36KO mice but not in WT mice (P < .01). Quantification of leakage is expressed as fold change of FITC-dextran fluorescence inside the villus versus fluorescence between epithelial cells measured in 5 random villi/mouse. Blue fluorescence, 2-harmonic generation; light purple fluorescence, autofluorescence. Scale bars: WT, 150 and 50 μm; CD36KO, 100 and 25 μm. (D) Electron microscopy images showing shortened desmosomes in intestinal epithelium of CD36KO mice. Scale bar: 500 nm. Graph shows quantification of decrease in desmosome length (n = 20/genotype, P = .001). (E) Expression of desmosomal protein desmocollin 2 is decreased in intestines of CD36KO mice compared with controls (P = .01, n = 8/genotype). (F) Level of tight junctional protein occludin measured in intestinal lysates by immunoblotting and densitometry quantification of change in occludin/β-actin as compared with WT control (P = .01) (n = 4/genotype). Data are representative of 3 (A–E) and 2 (F) experiments. Bar graphs show means ± SEM.
Figure 3
Figure 3
Deletion of CD36 in enterocytes does not alter gut permeability or associate with inflammation. (A–C) Generation and validation of a mouse with enterocyte specific CD36 deletion (Ent-KO). (A) Ent-KO CD36 mice were obtained by crossing CD36 floxed mice with mice carrying the villin-Cre recombinase. (B) PCR showing specific deletion of CD36 in the intestine but not in other tissues, Duod, duodenum; Jej, jejenum. (C) Immunofluorescence of intestinal sections from floxed controls (Fl/Fl) and Ent-KO mice showing absence of epithelial CD36 expression on enterocytes. Scale bar: 50 μm. (D) Intestines of Ent-KO mice do not display altered expression of collagen, fibronectin, and markers of inflammation. (E) Ent-KO mice did not show altered intestinal permeability measured by oral administration of FITC-dextran (4 kDa) as compared with floxed control mice. Values shown are means ± SEM. Data (CE) are representative of 2 experiments, n = 6 per genotype.
Figure 4
Figure 4
CD36 deletion induces systemic leukocytosis and neutrophilia. Peripheral blood was analyzed for white blood cells (WBC) and neutrophils by flow cytometry (n = 8/genotype). As compared with WT mice, CD36KO mice have (A) increased WBC count (P = .007) and (B) circulating neutrophils (CD11b+/Ly6G+) (P = .004). (C) Bone marrow neutrophil content (Ly6G+/Gr-1+) is increased in CD36KO mice (P = .0015) as compared with WT controls. (D) Representative images and quantification (based on 5 random fields/section) of bone marrow stained for MPO (P = .01) and TUNEL (P = .002) (n = 4/genotype). Scale bar: 2 μm. (E) Spleen neutrophil content (Ly6G+/Gr-1+) is increased in CD36KO as compared with WT mice (P = .0067) (n = 5/genotype). A–E, representative of 3 experiments. Graphs show mean ± SEM.
Figure 5
Figure 5
Circulating Ly6Clow monocytes are decreased in peripheral blood of CD36KO mice. As compared with WT controls, CD36KO mice show (A) lower monocyte number (CD115+/CD11b+) (P = .05), (B) similar number of Ly6Chigh monocytes, and (C) lower number of Ly6Clow monocytes (P = .01). (D) B-cell (CD19+) number trended higher, whereas that of NK/NK T cells (NK 1.1+) was unchanged in CD36KO mice. (A–D) (n = 9/genotype) representative of 3 experiments. Bar graphs show means ± SEM. *P < .05 by 2-tailed Student t test.
Figure 6
Figure 6
Bone marrow transplants support role of non-hematopoietic cells in the inflammation of CD36KO mice. (A) Chimeric mice lacking CD36 on non-hematopoietic cells (WT→KO) show highest level of leukocytosis as compared with control chimeric groups (WT→WT) (P = .05) and (KO→KO) (P = .02). WBC, white blood cells. (B) Neutrophil levels are also highest in WT→KO as compared with WT→WT (P = .011) and with KO→KO (P = .05) groups. (C) MPO staining showing neutrophil infiltration in small intestines of WT→KO group and quantification of MPO+ cells in intestinal sections from 3 mice/group (P = .01). (D) Monocyte levels are highest in WT→KO as compared with WT→WT (P = .018) and KO→KO (P = .01) groups. (E) Levels of Gr-1low are increased in WT→KO as compared with KO→KO (P = .0001) and KO→WT (P = .009) groups (n = 4/chimeric mice per group). (A–E) representative of 2 experiments. Graphs show data as means ± SEM.
Figure 7
Figure 7
Generation and validation of a mouse with endothelial cell specific CD36 deletion. (A) A mouse with endothelial cell deletion of CD36 (EC-CD36KO) was generated by breeding floxed (Fl/Fl) CD36 mice with mice carrying the Tie2-Cre recombinase (Cre+ males with Cre– females). PCR of DNA isolated from liver, muscle, and lung tissues of EC-CD36KO and floxed mice showing presence of null allele in EC-CD36KO mice. (B) Staining of intestinal villi from EC-CD36KO and Fl/Fl control mice with CD31 (marker of endothelial cells) and CD36. Insert: Blowup of areas indicated by white arrows showing CD36 expression in CD31+ cells in Fl/Fl but not in EC-CD36KO mice; scale bar: 30 μm. (C) CD36 protein levels in lysates from proximal intestines showing average 38% decrease in EC-CD36KO as compared with Fl/Fl mice (germline CD36KO mice are negative controls) (P = .05). (D) CD31 and CD36 mRNA expression in endothelial cells (CD146+) isolated from lungs of Fl/Fl and EC-CD36KO mice (n = 3/genotype). CD36 mRNA levels are reduced in CD146+ cells from EC-CD36KO mice as compared with Fl/Fl controls (P < .01), whereas CD31 mRNA levels are similar. Graphs show data as means ± SEM; n = 3/genotype.
Figure 8
Figure 8
CD36 deletion in endothelial cells causes fibronectin accumulation, neutrophil infiltration, and IL6 upregulation in the small intestine. (A) Intestines of EC-CD36KO mice have increased level of fibronectin (qRT-PCR) as compared with those of floxed (Fl/Fl) controls (P = .024), but expression of col1α or of α-SMA is not increased. Increased level of fibronectin in EC-CD36KO mice documented by fluorescent staining (right panel); scale bar: 100 μm (data representative of 2 experiments). (B) Inflammation markers: proximal intestines of EC-CD36KO mice show increases in IL6 (P = .04), JNK 1 (P = .05), JNK 2 (P = .02), and p-JNK (B and C) as compared with controls. Expression of TNF-α and IL10 is unaltered, whereas that of IL22 is reduced (P = .041) (n = 8/genotype). (D) Intestines of EC-CD36KO mice show enhanced MPO staining as compared with Fl/Fl controls (P = .01) (representative of 2 experiments) and (E) increased mRNA levels for neutrophil proteins Ncf-1 (P = .05), Ncf-2 (P = .041), and Ncf-4 (P = .009) (n = 8/genotype). Scale bar: 30 μm. Graphs show mean ± SEM.
Figure 9
Figure 9
Epithelial barrier permeability is compromised in mice with CD36 deletion specific to endothelial cells. (A) Plasma levels of FITC-dextran (4 kDa) at 0, 2, 4, and 6 hours after its intragastric administration to Flox/Flox (Fl/Fl) and EC-CD36KO mice (n = 6/genotype). A week later, the same mice groups received bolus of triolein (4.5 μL/g body weight) 30 minutes before FITC-dextran. Intestinal permeability is increased in all EC-CD36KO mice at 2 hours (P = .035; Ptriolein = .041) and 4 hours (P = .05; Ptriolein= .048) and only in EC-CD36KO given triolein at 6 hours (P = .43). #Fl/Fl versus EC-CD36KO, *Fl/Fltriolein versus EC-CD36KOtriolein. Right panel shows area under the curve (AUC) for FITC-dextran assay; AUCs for EC-CD36KO and EC-CD36KOtriolein are increased compared with appropriate Fl/Fl controls (P < .001 and P = .002, respectively). (B) Higher endotoxin levels in plasma of EC-CD36KO as compared with Fl/Fl mice at 4 hours after triolein bolus, P = .05 (n = 4/genotype). (C) Two-photon optical images showing epithelial leakage of fluorescein-dextran in EC-CD36KO mice (P < .01) compared with floxed control mice. Fluorescein-dextran 10 kDa (green) was injected intraluminally into anesthetized mice, and DyLight 594–conjugated tomato lectin (red) was given by retro-orbital injection 10 minutes before imaging from the luminal side (n = 3 mice/genotype). Quantification of leakage is expressed as fold change of FITC-dextran fluorescence inside the villus versus fluorescence between epithelial cells measured in 5 random villi/mouse. (D) Electron microscopy showing reduced length of desmosomes in EC-CD36KO mice compared with Fl/Fl controls (P < .001). (E) Desmocollin 2 expression is decreased in proximal intestines of EC-CD36KO (n = 4/genotype) (P = .05). (F) Immunoblots of occludin in lysates of proximal intestines showing reduced levels in EC-CD36KO mice. Graph shows densitometry of occludin/β-actin compared with that of Fl/Fl controls (P = .042) (representative of 2 experiments). (A–E) representative of 3 experiments. All graphs show means ± SEM.

References

    1. Silverstein R.L., Febbraio M. CD36, a scavenger receptor involved in immunity, metabolism, angiogenesis, and behavior. Sci Signal. 2009;2:re3. - PMC - PubMed
    1. Abumrad N.A., Davidson N.O. Role of the gut in lipid homeostasis. Physiol Rev. 2012;92:1061–1085. - PMC - PubMed
    1. Drover V.A., Ajmal M., Nassir F. CD36 deficiency impairs intestinal lipid secretion and clearance of chylomicrons from the blood. J Clin Invest. 2005;115:1290–1297. - PMC - PubMed
    1. Nauli A.M., Nassir F., Zheng S. CD36 is important for chylomicron formation and secretion and may mediate cholesterol uptake in the proximal intestine. Gastroenterology. 2006;131:1197–1207. - PMC - PubMed
    1. Peterson L.W., Artis D. Intestinal epithelial cells: regulators of barrier function and immune homeostasis. Nat Rev Immunol. 2014;14:141–153. - PubMed

LinkOut - more resources