

Addressing reverse inference in psychiatric neuroimaging: Meta-analyses of task-related brain activation in common mental disorders
- PMID: 28067006
- PMCID: PMC5347927
- DOI: 10.1002/hbm.23486
Addressing reverse inference in psychiatric neuroimaging: Meta-analyses of task-related brain activation in common mental disorders
Abstract
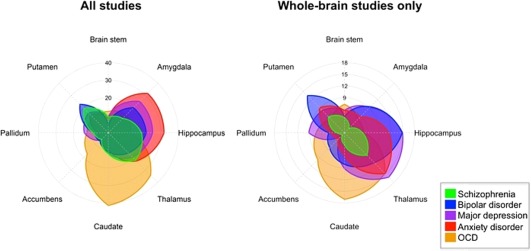
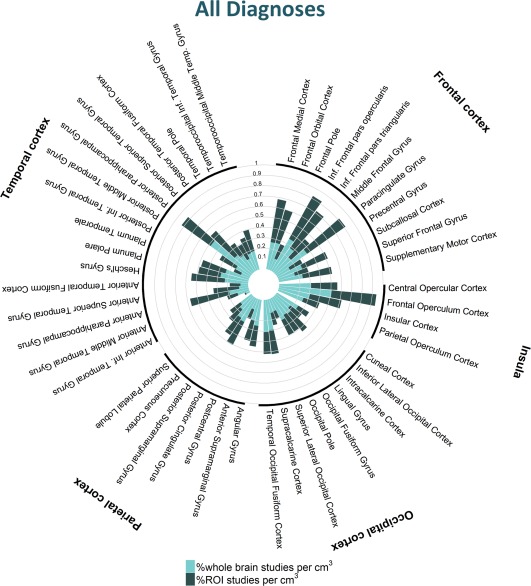
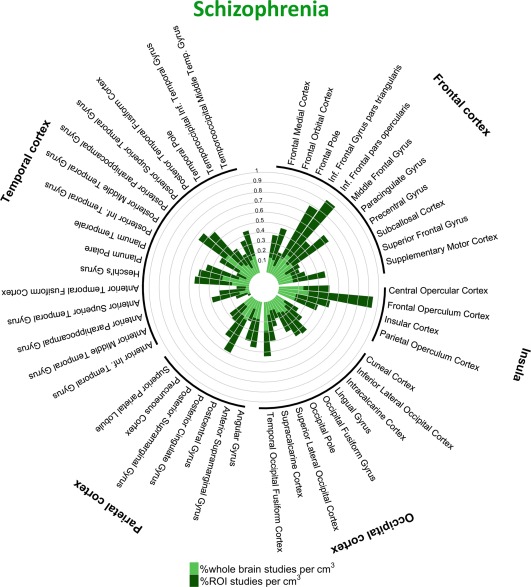
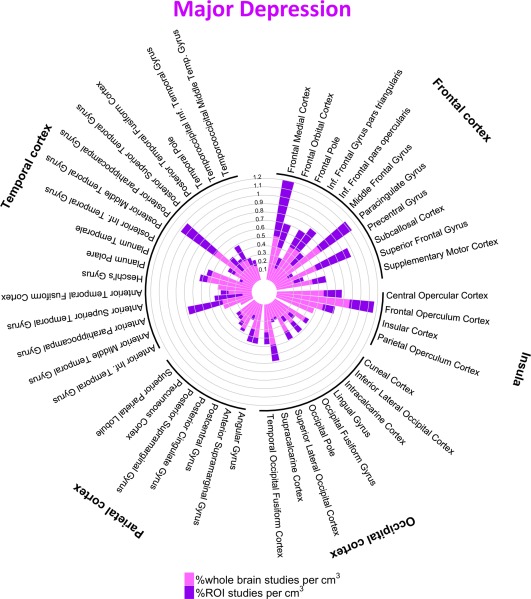
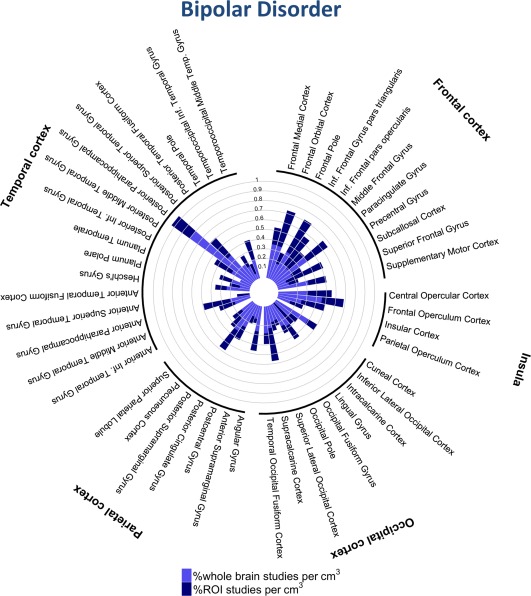
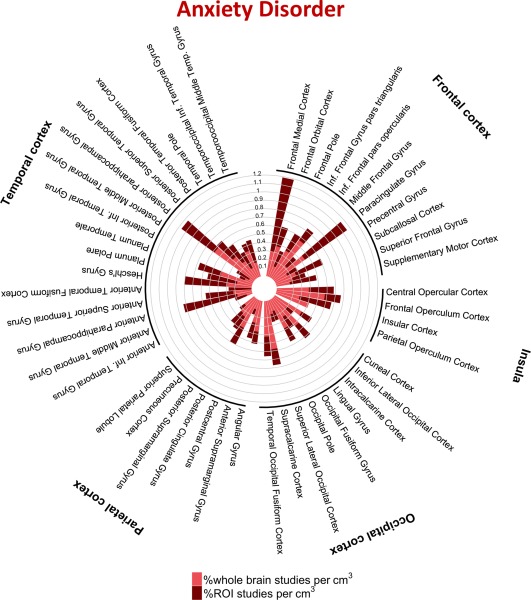
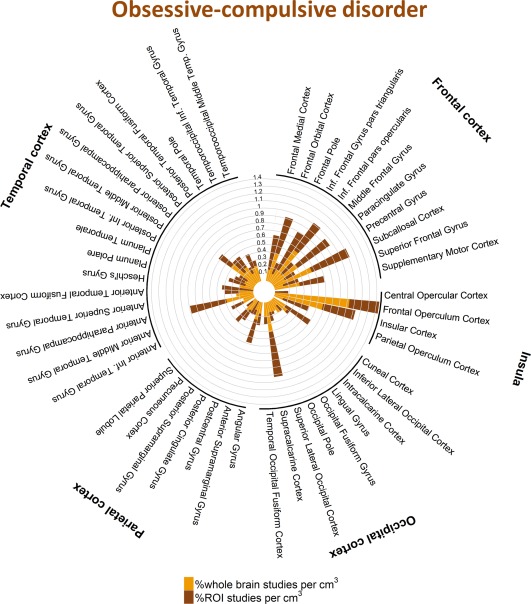
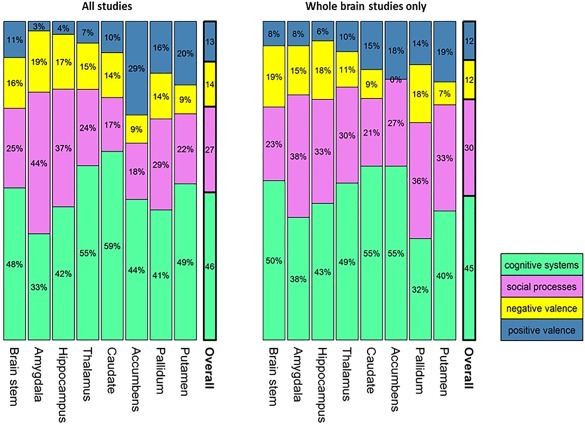
Functional magnetic resonance imaging (fMRI) studies in psychiatry use various tasks to identify case-control differences in the patterns of task-related brain activation. Differently activated regions are often ascribed disorder-specific functions in an attempt to link disease expression and brain function. We undertook a systematic meta-analysis of data from task-fMRI studies to examine the effect of diagnosis and study design on the spatial distribution and direction of case-control differences on brain activation. We mapped to atlas regions coordinates of case-control differences derived from 537 task-fMRI studies in schizophrenia, bipolar disorder, major depressive disorder, anxiety disorders, and obsessive compulsive disorder comprising observations derived from 21,427 participants. The fMRI tasks were classified according to the Research Domain Criteria (RDoC). We investigated whether diagnosis, RDoC domain or construct and use of regions-of-interest or whole-brain analyses influenced the neuroanatomical pattern of results. When considering all primary studies, we found an effect of diagnosis for the amygdala and caudate nucleus and an effect of RDoC domains and constructs for the amygdala, hippocampus, putamen and nucleus accumbens. In contrast, whole-brain studies did not identify any significant effect of diagnosis or RDoC domain or construct. These results resonate with prior reports of common brain structural and genetic underpinnings across these disorders and caution against attributing undue specificity to brain functional changes when forming explanatory models of psychiatric disorders. Hum Brain Mapp 38:1846-1864, 2017. © 2017 Wiley Periodicals, Inc.
Keywords: Research Domain Criteria; anxiety disorders; bipolar disorder; functional magnetic resonance imaging; major depressive disorder; meta-analyses; obsessive compulsive disorder; schizophrenia.
© 2017 The Authors Human Brain Mapping Published by Wiley Periodicals, Inc.
Figures
References
-
- Arnone D, Cavanagh J, Gerber D, Lawrie SM, Ebmeier KP, McIntosh AM (2009): Magnetic resonance imaging studies in bipolar disorder and schizophrenia: Meta‐analysis. Br J Psychiatry 195:194–201. - PubMed
-
- Beesdo K, Pine DS, Lieb R, Wittchen HU (2010): Incidence and risk patterns of anxiety and depressive disorders and categorization of generalized anxiety disorder. Arch Gen Psychiatry 67:47–57. - PubMed
-
- Chen CH, Suckling J, Lennox BR, Ooi C, Bullmore ET (2011): A quantitative meta‐analysis of fMRI studies in bipolar disorder. Bipolar Disord 13:1–15. - PubMed
Publication types
MeSH terms
Substances
Grants and funding
LinkOut - more resources
Full Text Sources
Other Literature Sources
Medical
