. 2017 Jan 9:8:13905.
doi: 10.1038/ncomms13905.

Characterization of the interplay between DNA repair and CRISPR/Cas9-induced DNA lesions at an endogenous locus

Affiliations

Characterization of the interplay between DNA repair and CRISPR/Cas9-induced DNA lesions at an endogenous locus

Anne Bothmer et al. Nat Commun. .

Abstract

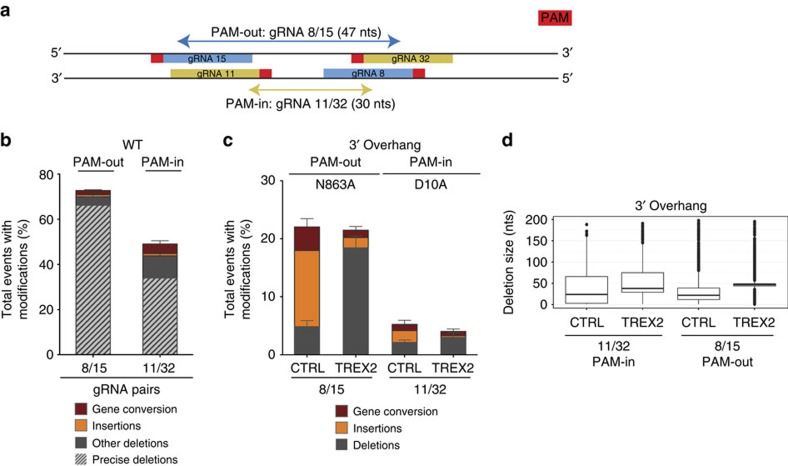
The CRISPR-Cas9 system provides a versatile toolkit for genome engineering that can introduce various DNA lesions at specific genomic locations. However, a better understanding of the nature of these lesions and the repair pathways engaged is critical to realizing the full potential of this technology. Here we characterize the different lesions arising from each Cas9 variant and the resulting repair pathway engagement. We demonstrate that the presence and polarity of the overhang structure is a critical determinant of double-strand break repair pathway choice. Similarly, single nicks deriving from different Cas9 variants differentially activate repair: D10A but not N863A-induced nicks are repaired by homologous recombination. Finally, we demonstrate that homologous recombination is required for repairing lesions using double-stranded, but not single-stranded DNA as a template. This detailed characterization of repair pathway choice in response to CRISPR-Cas9 enables a more deterministic approach for designing research and therapeutic genome engineering strategies.


Conflict of interest statement

A.B., T.P., L.A.B., C.M.M., C.S.L., F.B., S.M., H.S.A., W.S., H.J., V.E.M. and C.C-R. are current or former employees of and own options or shares of Editas Medicine, Inc. Editas Medicine is a company dedicated to using the CRISPR-Cas9 system to treating patients with genetic diseases. Patent applications were filed associated with results from this work.

Figures

Figure 1
Figure 1. DNA lesions introduced by different Cas9 variants result in different repair outcomes.
(a) Schematic of lesions introduced by either WT Cas9, D10A Cas9 or N863A Cas9 with gRNAs 8 and 15 (blue). The active nuclease domains are indicated for the respective mutants. PAMs are shown in red. The cut site is in white. (b) Overall modification frequency at the HBB locus separated into deletions, insertions and gene conversion events. The different repair outcomes after WT, D10A or N863A Cas9 activity in U2OS cells were measured by PCR amplification of the HBB locus, followed by Sanger sequencing of individual amplification products. Error bars were derived from five independent experiments. Data are represented as mean±s.e.m. Total number of sequences analysed was 569, 718 and 556 for WT Cas9, D10A Cas9 and N863A Cas9, respectively. (c) Plot of deletion size for WT (grey), D10A (green) and N863A (purple) Cas9 variants with gRNA 8 and 15 or only gRNA 8 in case of the WT Cas9. Individual deletion size data from each Cas9 variant were scored from Sanger sequencing and the total number of sequences analysed was 258, 241 and 103 for WT Cas9, D10A Cas9 and N863A Cas9, respectively.
Figure 2
Figure 2. Characterization of repair outcomes of lesions introduced with the D10A Cas9 variant using gRNA pair 8/15.
(a) Schematic illustration of the HBB and HBD loci on chromosome 11. (b) U2OS treated with an siRNA against firefly luciferase (control, labelled as FF), BRCA2 or RAD51 in addition to the D10A Cas9 and gRNAs 8/15. The overall modification frequency at the HBB locus resolved for deletions, insertions and gene conversion (GC) was determined by Sanger sequencing. P values (GC) were calculated using the two-tailed Student's t-test. Four independent experiments. Data are represented as mean±s.e.m. Total number of sequences analysed: 476, 407, 389 for siFF, siBRCA2 and siRAD51-treated cells. (c) The overall modification frequency resolved for deletions, insertions and GC scored by Sanger sequencing of the amplified HBB locus in U2OS cells expressing the D10A Cas9 and gRNAs 8/15 in the presence (TREX2) or absence (CTRL) of TREX2. Due to limiting amplicon size primer pairs underestimate deletion frequency. P value (GC) was calculated using the two-tailed Student's t-test. Five independent experiments. Total number of sequences: 578 for CTRL and 529 for TREX2. Data are represented as mean±s.e.m. (d) Scatter dot plot overlaid with a box and whisker plot representing the deletions size from Sanger sequences of U2SOS cells expressing D10A Cas9 with gRNAs 8/15 in the presence (TREX2) or absence (CTRL) of TREX2. Each individual dot represents one Sanger sequence with a deletion. Due to limiting amplicon size primer pairs underestimate deletion frequency. The line within the box depicts the median, with the box extending from the 25th to the 75th percentiles. The whiskers depict the minimum and maximum values of the data set. Five independent experiments, total number of sequences: 147 for CTRL and 149 for TREX2. (e) Graph showing positions of nucleotide mismatches (colours) and deletions (black) between the HBD and the HBB genes as coloured rods (top). Histogram of relative GC frequency plotted as a function of the position on the HBB locus (bottom). (f) Overall modification frequency at the HBB locus separated into deletions, insertions and GC from either the endogenous HBD gene or a plasmid source. The different repair outcomes after D10A or N863A Cas9 activity in U2OS cells followed by Sanger sequencing of individual HBB amplification products. Four independent experiments. Data are represented as mean±s.e.m. P value (Gene conversion (plasmid)) was calculated using the two-tailed Student's t-test. Total number of sequences analysed: 199 and 304 for D10A Cas9 and N863A Cas9.
Figure 3
Figure 3. Characterization of insertions deriving from the D10A and N863A Cas9 variants using gRNA pair 8/15 in PAM-out orientation.
(a) Histogram plot of insertion length for the D10A Cas9 (green) and N863A Cas9 (purple)-induced insertions. Individual insertion size data from each Cas9 variant was scored from Sanger sequencing data of U2OS cells treated with either D10A or N863A Cas9 and gRNA pair 8/15. Difference in length between D10A and N863A-induced insertions is significant: P=1.274 × 10⁻¹² (permutation test). Number of insertions plotted is 75 for D10A and 325 for N863A. (b) Example of insertions of the full overhang resulting from N863A and D10A Cas9-induced lesions. Insertions (indicated as filled orange arrows) induced from D10A Cas9 do not show overlap while those from N863A Cas9 do indicating microhomology usage in the latter case (indicated in black box). Position of gRNA indicated in blue, with red box representing the PAM. (c) Overall modification frequency resolved for deletions, insertions and gene conversion scored by Sanger sequencing of the amplified HBB locus in U2OS cells expressing the N863A Cas9 variant and gRNA pair 8/15 in the presence (TREX2) or absence (CTRL) of TREX2. The P value for the difference in insertion frequency was calculated using the two-tailed Student's t-test. Data are represented as mean±s.e.m. The total number of sequences plotted from six independent experiments is 684 for CTRL and 672 for TREX2-expressing cells. (d) Scatter dot plot overlaid with a box and whisker plot representing the deletions size scored from Sanger sequencing data of U2SOS cells expressing the N863A Cas9 variant with gRNA pair 8/15 in the presence (TREX2) or absence (CTRL) of TREX2. Each individual dot represents one Sanger sequenced read harbouring a deletion. The total number of sequences plotted from six independent experiments is 87 for control and 264 for TREX2-expressing cells. The line within the box depicts the median, with the box extending from the 25th to the 75th percentiles. The whiskers depict the minimum and maximum values of the data set.
Figure 4
Figure 4. Paired nickase-induced lesions in the PAM-in orientation do not result in efficient strand separation and locus modification.
(a) Schematic showing the position of gRNAs 8, 15, 11 and 32 on the HBB locus, alongside the predicted overhang length and PAM orientation (red). (b) Overall modification frequency resolved for deletions, insertions and gene conversion scored by Sanger sequencing of the amplified HBB locus in U2OS cells expressing the WT Cas9 variant and gRNA pairs 8/15 (PAM-out) or 11/32 (PAM-in). Data are represented as mean±s.e.m. Total number of sequences from four independent experiments is 324 for gRNA pair 8/15 and 280 for gRNA pair 11/32. (c) Overall modification frequency resolved for deletions, insertions and gene conversion scored by Sanger sequencing of the amplified HBB locus in U2OS cells expressing the N863A Cas9 variant and gRNA pair 8/15 (PAM-out) or the D10A Cas9 variant and gRNA pair 11/32 (PAM-in) in the presence (TREX2) or absence (CTRL) of the 3′–5′ exonuclease TREX2. gRNA expression was driven from PCR products containing the U6 promoter, gRNA sequence and TRACR (Methods). Data are represented as mean±s.e.m. The total number of sequences from three independent experiments is 203 for gRNA pair 8/15 CTRL, 572 for gRNA pair 11/32 CTRL, 224 for gRNA pair 8/15 TREX2 and 270 for gRNA pair 11/32 TREX2. (d) Box–whisker plot depicting the deletion size for either PAM-in gRNA pair 11/32 or PAM-out gRNA pair 8/15. Deletions were determined from sequences read by Illumina MiSeq. The line within the box depicts the median, with the box extending from the 25th to the 75th percentiles. The whiskers depict the minimum and maximum values within 1.5 inter-quartile range (IQR) of the median. Points with distance to median >1.5 IQR are shown individually.
Figure 5
Figure 5. Characterization of gene correction using an ssODN.
(a) Overall modification frequency at the HBB locus resolved for deletions, insertions, gene conversion (GC), and gene correction. The different repair outcomes after WT, D10A or N863A Cas9 activity in the presence of the ‘high mismatch donor' in U2OS cells were measured by Sanger sequencing of individual HBB amplification products. Data are represented as mean±s.e.m. The P values (gene correction) were calculated using the two-tailed Student's t-test. Total number of sequences plotted from three independent experiments: 200 for WT Cas9, 448 for D10A Cas9, and 422 for N863A Cas9. (b) Characterization of genetic requirements of gene correction. U2OS cells expressing an siRNA against control firefly luciferase (FF), BRCA2 or RAD51, in addition to D10A Cas9 and gRNAs 8/15 and the ‘high mismatch donor'. The overall modification frequency at the HBB locus resolved for deletions, insertions, GC and gene correction was determined by Sanger sequencing. Data are represented as mean±s.e.m. The total number of sequences from at least four independent experiments is 770 for FF, 652 for siBRCA2 and 657 for siRAD51-treated cells. (c) Overall modification frequency resolved for deletions, insertions, GC and gene correction scored by Sanger sequencing of the amplified HBB locus in U2OS cells expressing D10A Cas9, gRNAs 8/15 and the ‘high mismatch donor' donor in the presence (TREX2) or absence (CTRL) of TREX2. Data are represented as mean±s.e.m. The P value (gene correction) was calculated using the two-tailed Student's t-test. Total number of sequences from three independent experiments: 436 for CTRL and 338 for TREX2. (d) Overall modification frequency resolved for deletions, insertions, GC and gene correction using the ‘no mismatch donor' containing no mismatches for D10A or N863A Cas9 dual nick-induced, processed overhangs in U2OS cells. PCR amplification of the HBB locus was followed by MiSeq sequencing of individual amplification products and computational analysis to categorize repair events (see Methods). Data are represented as mean±s.e.m. The P value (gene correction) was calculated using the two-tailed Student's t-test.
Figure 6
Figure 6. Characterization of repair pathway engagement of Cas9 variant-induced single nicks.
(a) Frequency of deletions, insertions, gene conversion and gene correction (using the ‘high mismatch ssODN') from U2OS cells nucleofected with D10A Cas9 and N863A Cas9 and gRNA 8. Sequencing was performed using an Illumina MiSeq and modifications were quantified computationally (Methods). Three independent experiments. The P values for the difference in gene correction and gene conversion frequency was calculated using the two-tailed Student's t-test. Data are represented as mean±s.e.m. (b) Frequency of deletions, insertions, gene conversion and gene correction (using the ‘high mismatch ssODN') observed after U2OS cells were nucleofected with WT, D10A, or N863A Cas9 and gRNA 8, and an siRNA against RAD51 or firefly luciferase (FF) control. Sequencing was performed using an Illumina MiSeq and modifications were quantified computationally using (Methods). Three independent experiments. Data are represented as mean±s.e.m. (c) Bar graph of fold change in the rates of total editing events and gene correction (using the ‘high mismatch ssODN') for the D10A and N863A Cas9 mutants of cells treated with and siRNA against RAD51 relative to FF treated control. Three independent experiments. Data are represented as mean±s.e.m. (d) Representative histogram of the length of WT Cas9 and gRNA 8 or D10A Cas9 and gRNA 8-induced deletions in the presence or absence of RAD51.
Figure 7
Figure 7. Models.
(a) Model depicting the predominant engagement of c-NHEJ for the repair of WT Cas9 induced DSBs. (b) Model depicting the predominant engagement of HDR for the repair of D10A Cas9-induced DSBs with gRNAs in PAM-out configuration. (c) Model depicting the predominant engagement of a-NHEJ/SD-MMEJ and HDR for the repair of N863A Cas9-induced DSBs with gRNAs in PAM-out configuration.

References

    1. Hsu P. D., Lander E. S. & Zhang F. Development and applications of CRISPR-Cas9 for genome engineering. Cell 157, 1262–1278 (2014). - PMC - PubMed
    1. Doudna J. A. & Charpentier E. The new frontier of genome engineering with CRISPR-Cas9. Science 346, 1258096–1258096 (2014). - PubMed
    1. Gasiunas G., Barrangou R., Horvath P. & Siksnys V. Cas9-crRNA ribonucleoprotein complex mediates specific DNA cleavage for adaptive immunity in bacteria. Proc. Natl. Acad Sci. USA 109, E2579–E2586 (2012). - PMC - PubMed
    1. Jinek M. et al. A programmable dual-RNA-guided DNA endonuclease in adaptive bacterial immunity. Science 337, 816–821 (2012). - PMC - PubMed
    1. Cong L. et al. Multiplex genome engineering using CRISPR/Cas systems. Science 339, 819–823 (2013). - PMC - PubMed

MeSH terms