. 2017 Jan 9:7:40321.
doi: 10.1038/srep40321.

Drug Response Prediction as a Link Prediction Problem

Affiliations

Drug Response Prediction as a Link Prediction Problem

Zachary Stanfield et al. Sci Rep. .

Erratum in

Abstract

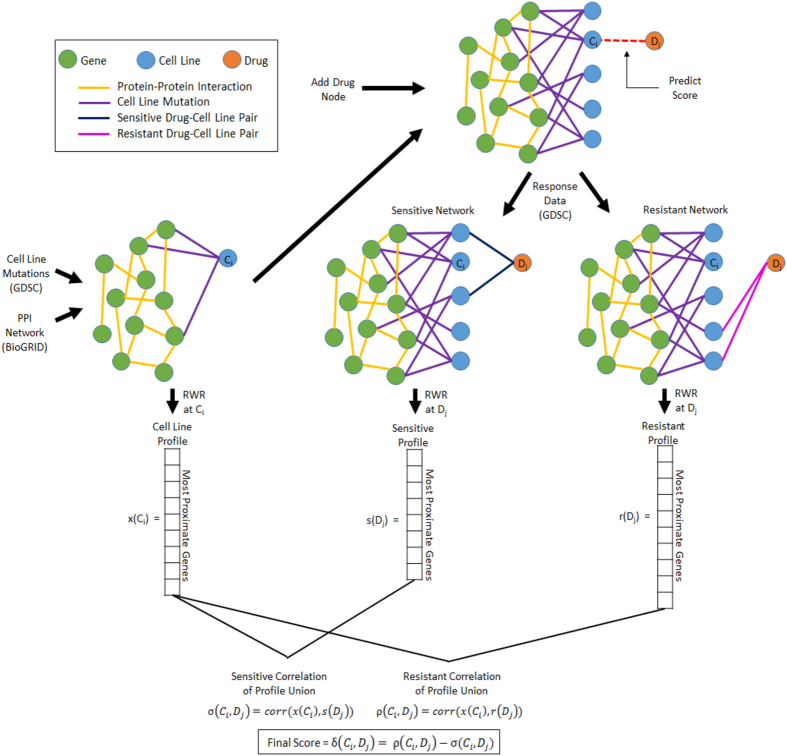
Drug response prediction is a well-studied problem in which the molecular profile of a given sample is used to predict the effect of a given drug on that sample. Effective solutions to this problem hold the key for precision medicine. In cancer research, genomic data from cell lines are often utilized as features to develop machine learning models predictive of drug response. Molecular networks provide a functional context for the integration of genomic features, thereby resulting in robust and reproducible predictive models. However, inclusion of network data increases dimensionality and poses additional challenges for common machine learning tasks. To overcome these challenges, we here formulate drug response prediction as a link prediction problem. For this purpose, we represent drug response data for a large cohort of cell lines as a heterogeneous network. Using this network, we compute "network profiles" for cell lines and drugs. We then use the associations between these profiles to predict links between drugs and cell lines. Through leave-one-out cross validation and cross-classification on independent datasets, we show that this approach leads to accurate and reproducible classification of sensitive and resistant cell line-drug pairs, with 85% accuracy. We also examine the biological relevance of the network profiles.


Figures

Figure 1
Figure 1. Workflow of the proposed computational method for network-based prediction of drug response.
Network profiles for cell lines and drugs, vectors representing proximity to genes mutated in cell lines of interest, are generated at separate stages using a fast random walk with restart (RWR) on a heterogeneous network consisting of edges representing response of cell lines to drugs, mutations of genes in these cell lines, and interactions among proteins coded by these genes. Two profiles are calculated for a drug, sensitivity profile and resistance profile by using networks that respectively contain sensitive cell lines and resistant cell lines separately for each drug. Based on the similarity of these profiles, a sensitivity score and a resistance score is calculated for each cell line-drug pair. The final score for each cell line-drug pair is obtained by subtracting the sensitivity score from the resistance score. The final score is used to assess the likelihood that the cell line is sensitive to the drug.
Figure 2
Figure 2. Performance of the proposed link prediction method on the GDSC Dataset.
(a) Each data point on the graph corresponds to a single cell line-drug pair. The x axis shows the predicted sensitivity score, the y axis shows the predicted resistance score for each cell line-drug pair. The color reflects the measured IC50 value for that pair: yellow indicates resistant and blue indicates sensitive. The black line (y = x) is the intuitive classification line of sensitive and resistant pairs as any data point below the line will have a higher sensitivity score than resistance (and vice versa). (b) Prediction performance as a function of the restart probability in random walk with restarts. (c) Prediction performance as a function of the parameter (ε) that controls the sparsity of the network profiles. The left-most point corresponds to using the full profiles (i.e. utilization of all genes in the network profiles). (b) and (c) show that when the network information used is very limited, performance decreases. For a, the following parameters were used: α = 0.7, ε = 1e − 5.
Figure 3
Figure 3. Performance of the proposed link prediction method “trained” using cell lines from GDSC on cell lines obtained from CCLE.
As in Fig. 2a, each data point is a cell line-drug pair where the x-axis and y-axis respectively show the predicted sensitivity and resistance scores. The colors here corresponds to the IC50 values in the CCLE dataset for the 2,585 new pairs. The following parameters values were used: α = 0.7, ε = 1e − 5.
Figure 4
Figure 4. Performance of network-based classification for predicting “drugs for cell lines” vs. “cell lines for drugs”.
The area under ROC curve (AUC) for leave-out-cross validation (LOOCV) on GDSC and cross-classification on CCLE based on GDSC-training for the two different settings are shown respectively in (a) and (b). “Cell lines” refers to predicting drugs for a given cell line, whereas “Drugs” refers to predicting cell lines for a given drug. The distribution of means and standard deviations of predicted scores for drugs (cell lines) per cell line (drug) in the GDSC LOOCV experiments are shown respectively in (c) and (d). The distribution of cell line sensitivity across drugs and drug efficacy across cell lines in the GDSC data are shown respectively in (e) and (f).
Figure 5
Figure 5. Comparison of the performance of the proposed network-based prediction algorithm against the KBMTL algorithm.
The distribution of the area under ROC curve achieved by each algorithm for predicting drugs for each cell line is shown for LOOCV on GDSC (a) and cross-classification on CCLE with training on GDSC (b). The distribution of the area under ROC curve achieved by each algorithm for predicting cell lines for each drug is shown for LOOCV on GDSC (c) and cross-classification on CCLE with training on GDSC (d).
Figure 6
Figure 6. Functional annotation of drug profiles.
Genes included in sensitivity and resistance profiles for two drugs are input into the online tool DAVID for functional enrichment analysis. Genes occurring in both profiles are excluded from this analysis. A subset of the most enriched annotations are chosen for comparison for two drugs, PF-562271 (a) and Nutlin-3a (b). PF-562271 targets focal adhesion kinase, which is involved in cellular adhesion. Four terms relating to adhesion are highly enriched in the resistant node set versus the sensitive. Conversely, ubl conjugation pathway and protein ubiquitination are highly enriched in the sensitive node set for Nutlin-3a, whose target is Mdm2 (or E3 ubiquitin-protein ligase).

References

    1. Meyerson M., Gabriel S. & Getz G. Advances in understanding cancer genomes through second-generation sequencing. Nature Publishing Group 11, 685–696 (2010). - PubMed
    1. Buermans H. P. J. & den Dunnen J. T. Next generation sequencing technology : Advances and applications. Biochimica et Biophysica Acta 1842, 1932–1941 ( 2014). - PubMed
    1. Varghese A. M. & Berger M. F. Advancing clinical oncology through genome biology and technology. Genome Biology 15, 1–7 (2014). - PMC - PubMed
    1. Chen R. & Snyder M. Promise of Personalized Omics to Precision Medicine. Wiley Interdiscip Rev Syst Biol Med 5, 73–82 (2013). - PMC - PubMed
    1. Yang W. et al.. Genomics of Drug Sensitivity in Cancer (GDSC): a resource for therapeutic biomarker discovery in cancer cells. Nucleic acids research 41, D955–61 (2013). - PMC - PubMed

Publication types

Substances