. 2017 Jan 9:7:39968.
doi: 10.1038/srep39968.

Perceptual similarity and the neural correlates of geometrical illusions in human brain structure

Affiliations

Perceptual similarity and the neural correlates of geometrical illusions in human brain structure

Vadim Axelrod et al. Sci Rep. .

Abstract

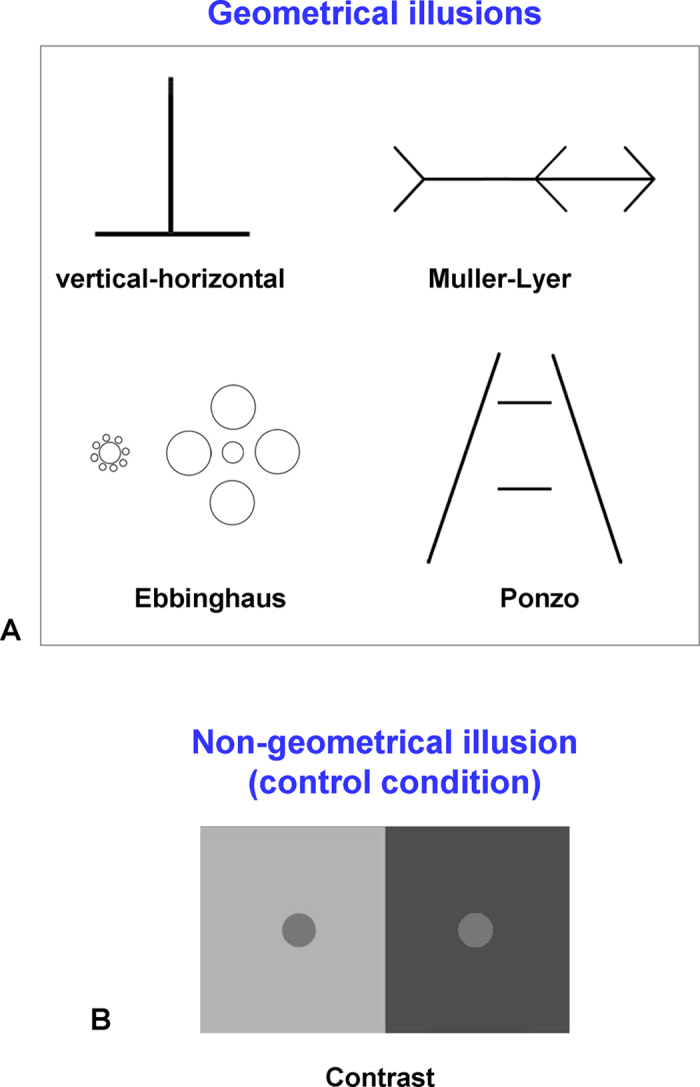
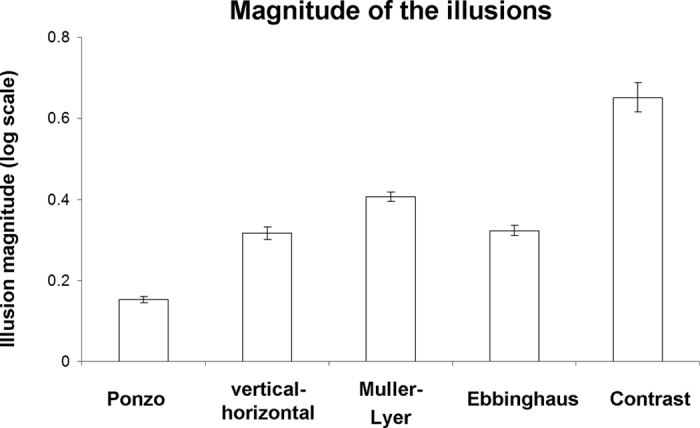
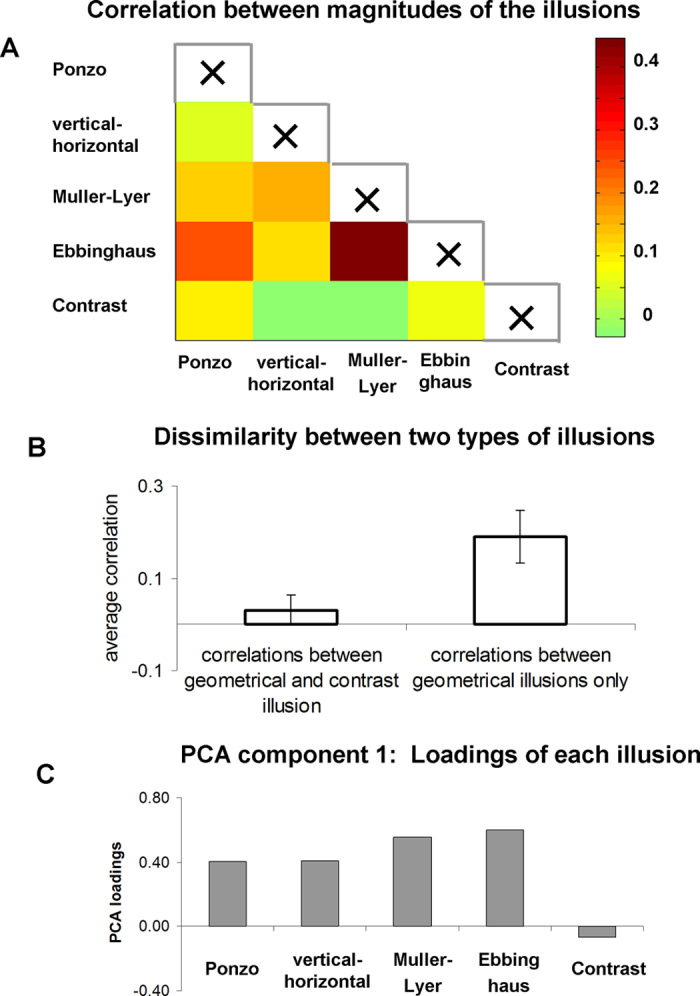
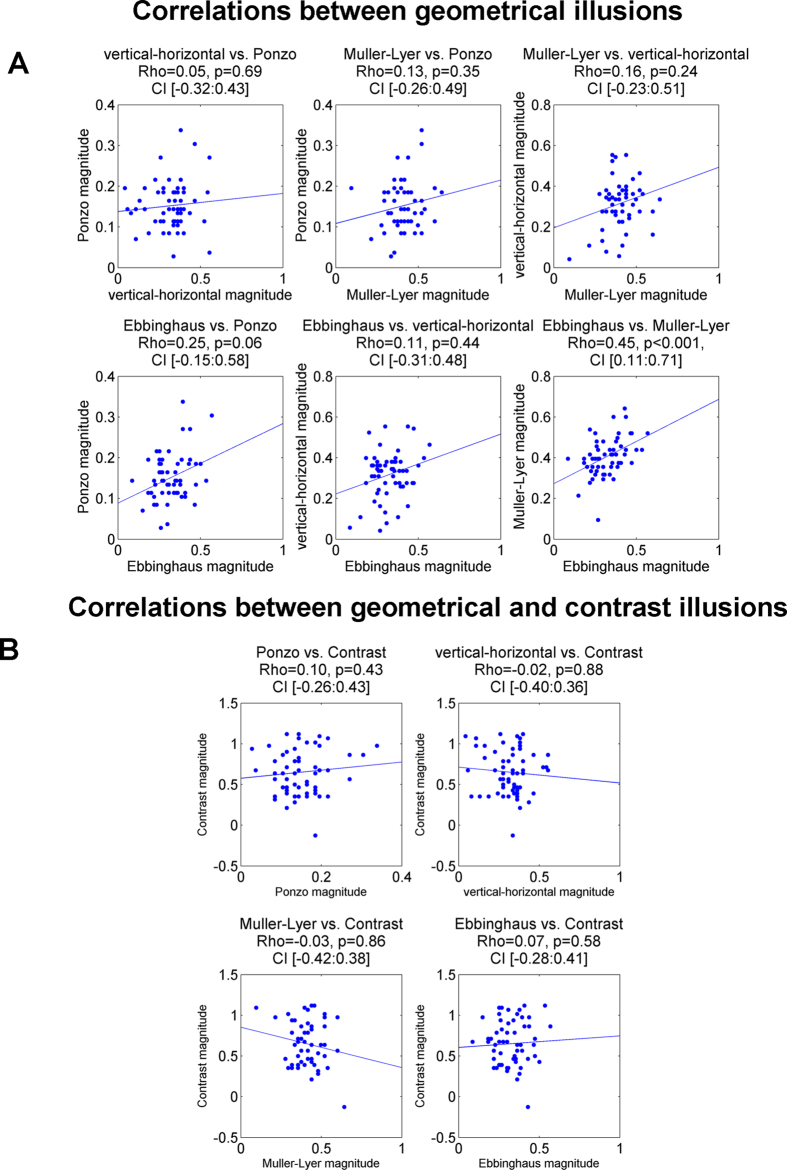
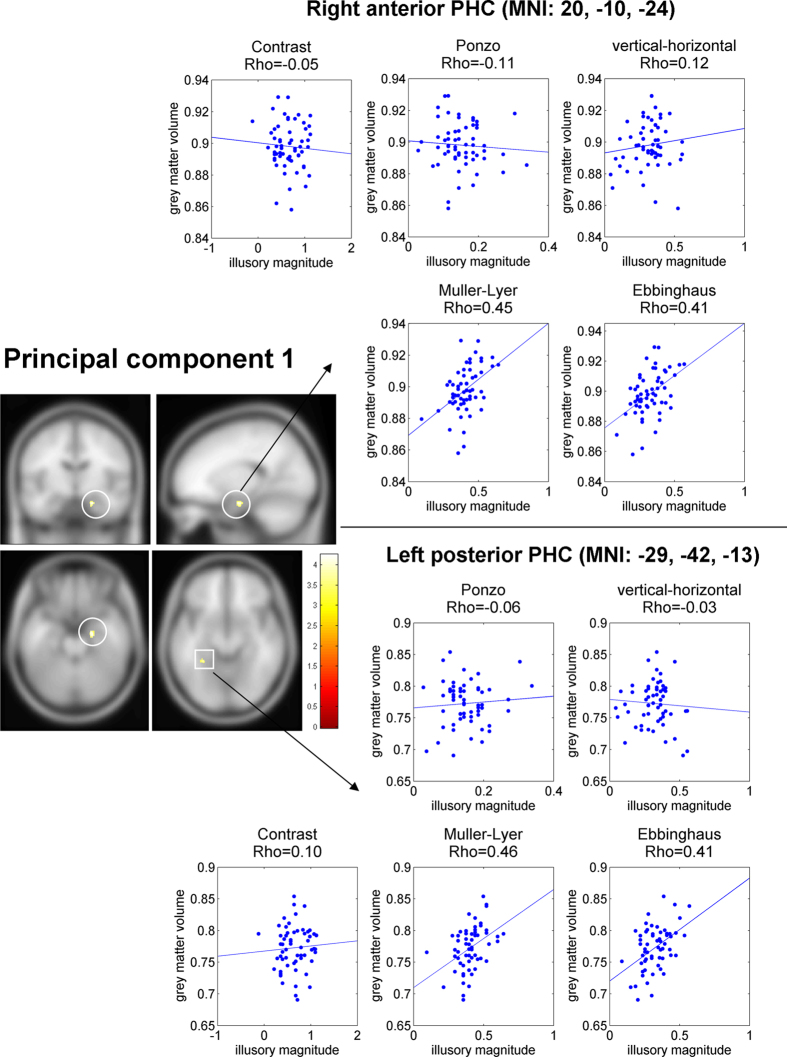
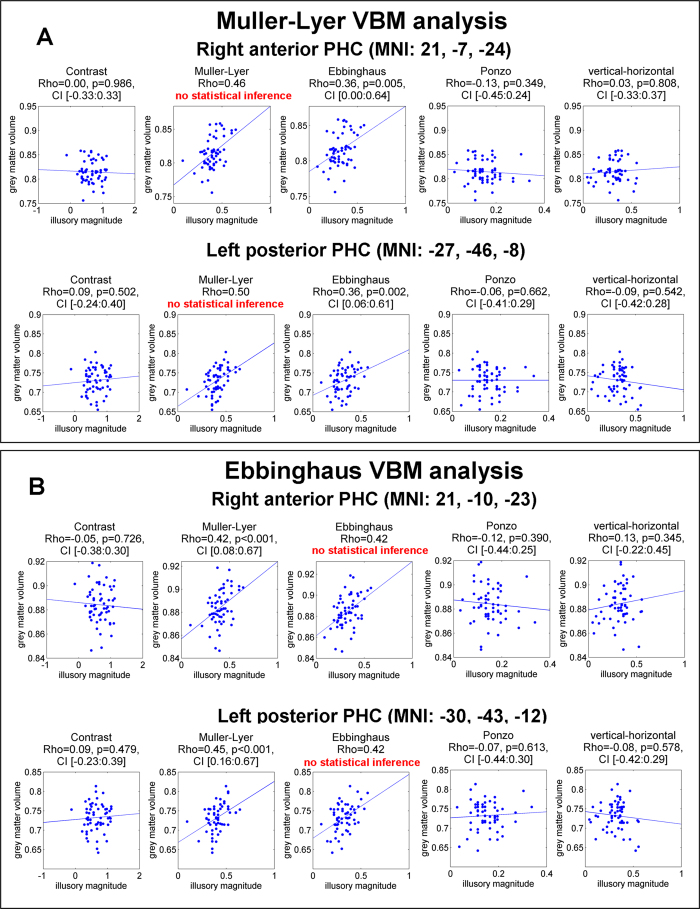
Geometrical visual illusions are an intriguing phenomenon, in which subjective perception consistently misjudges the objective, physical properties of the visual stimulus. Prominent theoretical proposals have been advanced attempting to find common mechanisms across illusions. But empirically testing the similarity between illusions has been notoriously difficult because illusions have very different visual appearances. Here we overcome this difficulty by capitalizing on the variability of the illusory magnitude across participants. Fifty-nine healthy volunteers participated in the study that included measurement of individual illusion magnitude and structural MRI scanning. We tested the Muller-Lyer, Ebbinghaus, Ponzo, and vertical-horizontal geometrical illusions as well as a non-geometrical, contrast illusion. We found some degree of similarity in behavioral judgments of all tested geometrical illusions, but not between geometrical illusions and non-geometrical, contrast illusion. The highest similarity was found between Ebbinghaus and Muller-Lyer geometrical illusions. Furthermore, the magnitude of all geometrical illusions, and particularly the Ebbinghaus and Muller-Lyer illusions, correlated with local gray matter density in the parahippocampal cortex, but not in other brain areas. Our findings suggest that visuospatial integration and scene construction processes might partly mediate individual differences in geometric illusory perception. Overall, these findings contribute to a better understanding of the mechanisms behind geometrical illusions.


Figures

Figure 1
Figure 1. Illusion stimuli used in the experiment.
(A) Four geometrical illusions: vertical-horizontal, Muller-Lyer, Ebbinghaus, and Ponzo illusions. To measure the illusory effect, participants were asked to manually adjust the correspondent segments so two corresponding parts of a figure would appear to them as perceptually equal. In the vertical-horizontal illusion, participants adjusted the vertical bar; in the Muller-Lyer illusion, participants adjusted the position of the central arrow; in the Ebbinghaus illusion, participants adjusted the size of the right central circle; and in the Ponzo illusion, participants adjusted the length of the top horizontal bar. Note that in the stimuli shown in the figure, the corresponding segments are equivalent (e.g., the left and right parts of the line in the Muller-Lyer illusion are equal). (B) Non-geometrical control contrast illusion. Participants were asked to adjust the brightness of the right circle, so it would have the same brightness as the left one. In the stimulus shown in the figure, the two circles are the same brightness.
Figure 2
Figure 2. Illusion magnitudes (behavioral results).
The illusory magnitude values reflect the binary logarithm (base 2) of the ratio between perceptual estimation and the real stimulus dimension (for geometrical illusions) or brightness (for contrast illusion). Values above zero reflect an illusory effect. Note, that illusory effects were found for all the illusions. Error bars denote standard error of mean. Individual illusory magnitude values can be found in Fig. 4.
Figure 3
Figure 3. Similarity between illusions (behavioral results).
(A) Correlations between magnitudes of the illusions across participants (Spearman correlation). Note that 1) the correlations between geometrical illusions was on average higher than correlations between geometrical illusions and contrast illusion; and 2) the strongest correlation was found between the Muller-Lyer and Ebbinghaus illusion. The scatter-plots of these correlations are shown in Fig. 4. (B) Comparison of average correlations of magnitudes of the illusions among the geometrical illusions (right), and between geometrical and contrast illusion (left). Note a clear difference between the two groups. Error bars denote standard error of mean. (C) Loadings of each illusion for the first PCA component that explained 36% of the total variance. Note a clear dissociation between geometrical and contrast illusions. The sign of the PCA loadings is arbitrary.
Figure 4
Figure 4. Scatter plots of correlations for all illusion pairs.
(A) Correlation between illusory effects of geometrical illusions. Note the significant correlation between the Muller-Lyer and Ebbinghaus illusions. (B) Correlations between the illusory effects of the geometrical and the contrast illusions. The dots denote individual magnitude for corresponding illusion. The tendency lines were obtained as an ordinary least squares (OLS) fit. Statistical results are Rho of Spearman correlation, permutation p-values and 99.5% confidence interval using permutation analysis.
Figure 5
Figure 5. Result of VBM analysis for the first PCA component of the illusory magnitude and ROI correlation analyses for the significant clusters.
Left: Two clusters in the right anterior parahippocampal cortex (PHC) and the left posterior PHC showed a significant correlation between local gray matter density and magnitude of first PCA component (p-value < 0.05, corrected). Right: scatter plots of correlation between gray matter density and illusory effect for the two clusters in the right anterior PHC and the left posterior PHC for four geometrical illusions. Each dot corresponds to an individual participant. Note, that because the behavioral values used for identifying the cluster (i.e., principal component of illusory magnitude) and behavioral values in the correlation (i.e., individual illusions magnitudes) were partially dependent, we did not conduct statistical inference of these correlations (i.e., no p-value or confidence interval was calculated). These correlations are presented only for visualization. Note the high correlation for the Ebbinghaus and Muller-Lyer illusions in both clusters. MNI coordinates of the clusters denote cluster center of mass.
Figure 6
Figure 6. Scatter plots of ROI correlation between gray matter density and illusory magnitude for five illusions in the clusters that were identified using VBM analysis.
(A) Correlations for clusters that were identified using Muller-Lyer illusion. No statistical inference was conducted for the Muller-Lyer illusion because the same data were used for identifying the cluster. The non-independent correlations are presented only for visualization. Note the high and statistically significant correlation for the Ebbinghaus illusion in both clusters. (B) Correlations for the clusters that were identified using Ebbinghaus illusion. No statistical inference was conducted for the Ebbinghaus illusion, because the same data were used for identifying the cluster. The non-independent correlations are presented only for visualization. Note the high and statistically significant correlation for the Muller-Lyer illusion in both clusters. Statistical results are Rho of Spearman correlation, permutation p-values and 99% confidence interval using permutation analysis.

References

    1. Eagleman D. M. Visual illusions and neurobiology. Nature Reviews Neuroscience 2, 920–926 (2001). - PubMed
    1. Robinson J. O. The psychology of visual illusion. (Dover Publications, New York, 1998).
    1. Woloszyn M. R. Contrasting three popular explanations for the Muller-Lyer Illusion. Current Research in Psychology 1, 102–107 (2010).
    1. Changizi M. A., Hsieh A., Nijhawan R., Kanai R. & Shimojo S. Perceiving the present and a systematization of illusions. Cognitive Science 32, 459–503 (2008). - PubMed
    1. Day R. Visual spatial illusions: A general explanation. Science 175, 1335–1340 (1972). - PubMed

Publication types

LinkOut - more resources