. 2017 Feb 1;127(2):549-563.
doi: 10.1172/JCI89616. Epub 2017 Jan 9.

Targeting deregulated AMPK/mTORC1 pathways improves muscle function in myotonic dystrophy type I

Targeting deregulated AMPK/mTORC1 pathways improves muscle function in myotonic dystrophy type I

Marielle Brockhoff et al. J Clin Invest. .

Abstract

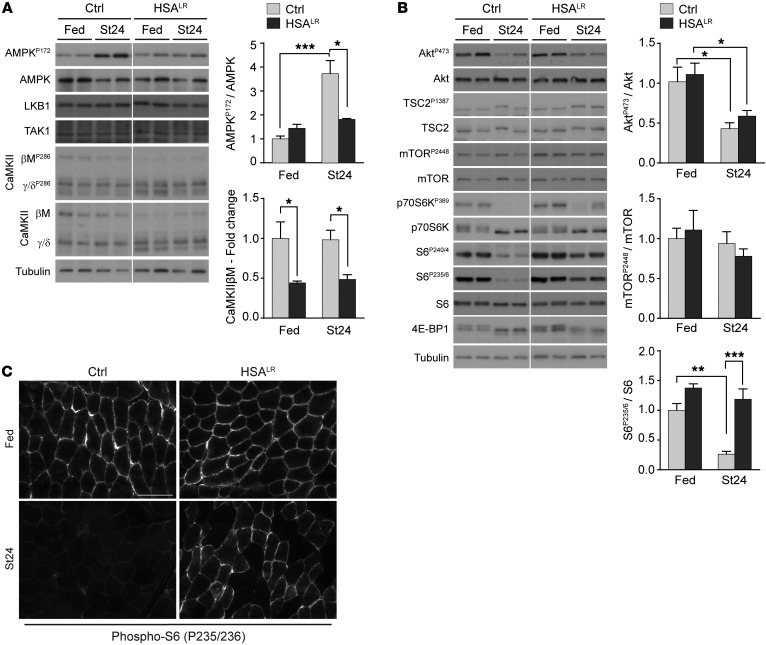
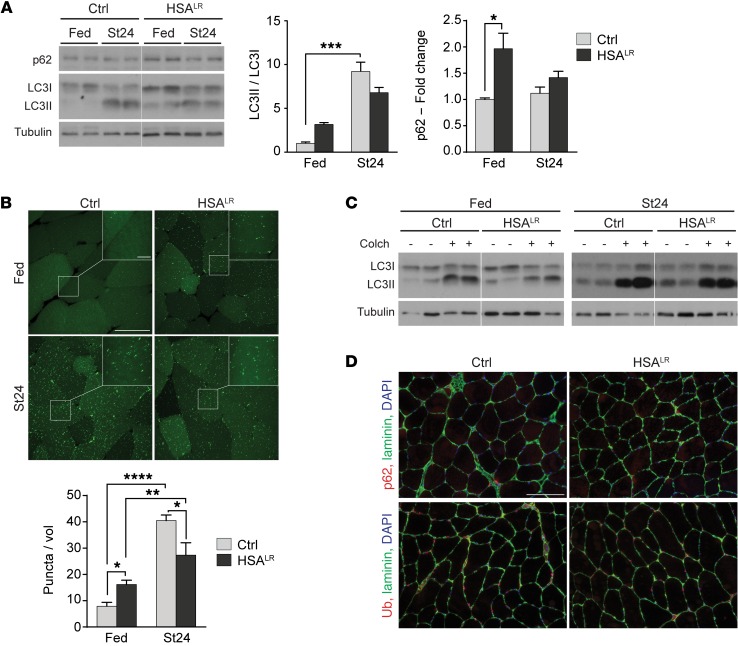
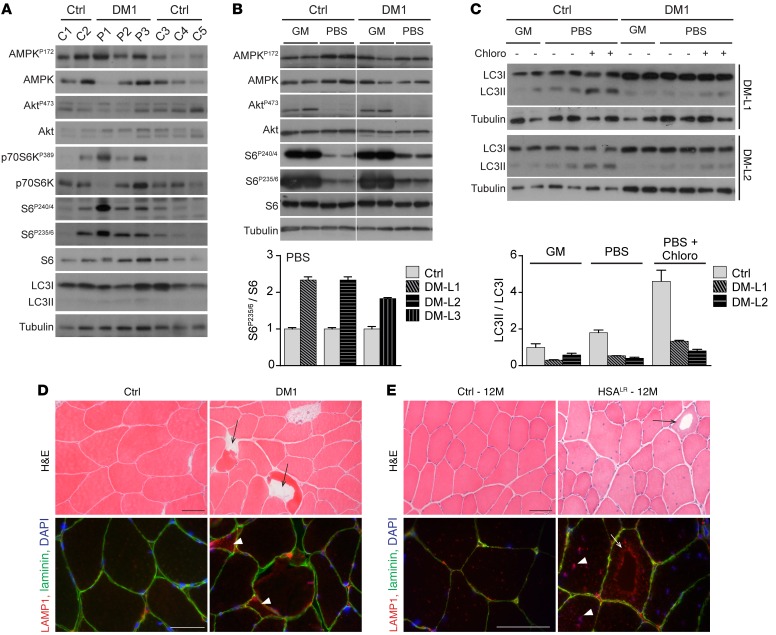
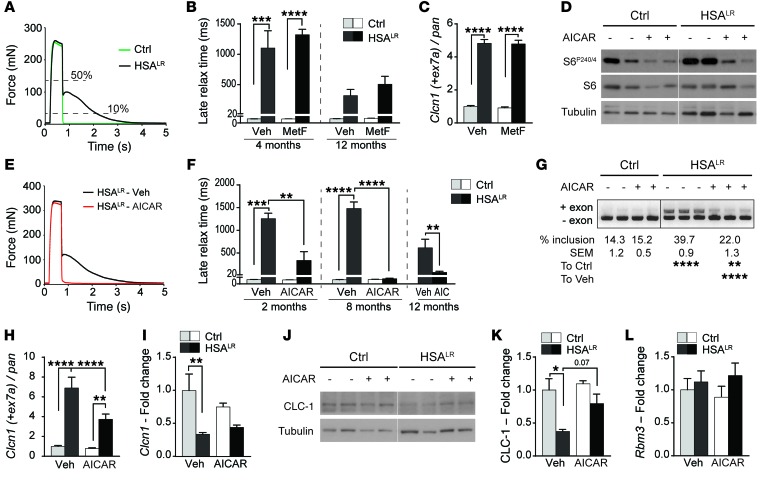
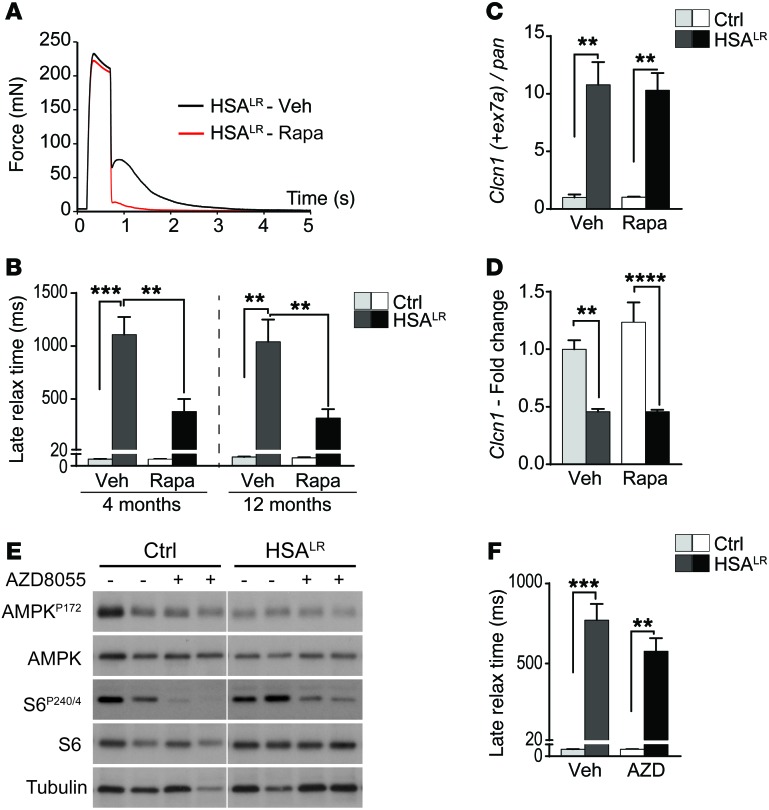
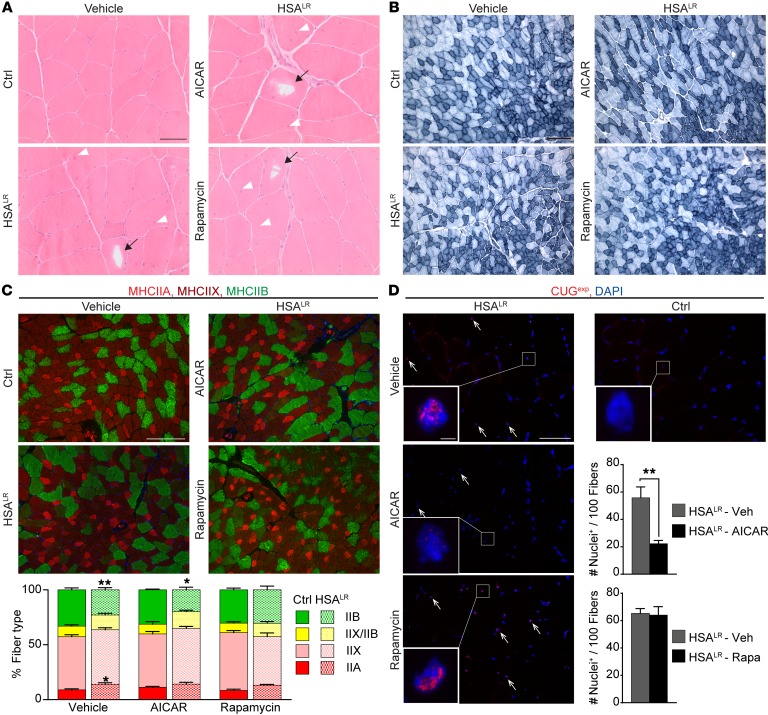
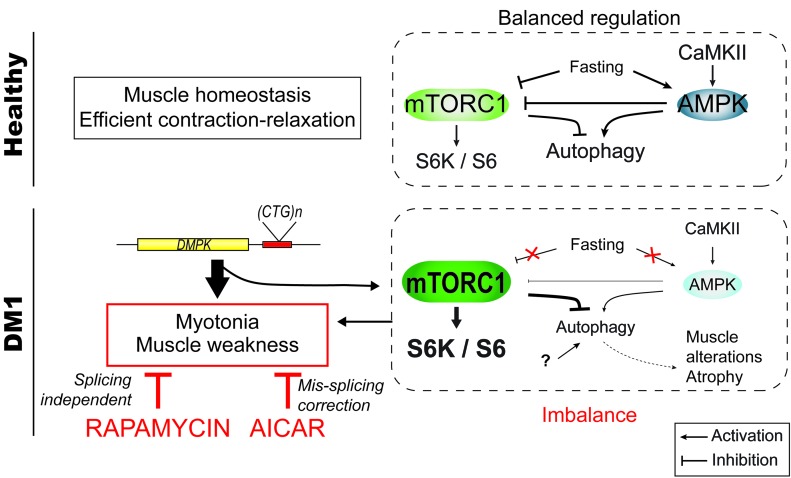
Myotonic dystrophy type I (DM1) is a disabling multisystemic disease that predominantly affects skeletal muscle. It is caused by expanded CTG repeats in the 3'-UTR of the dystrophia myotonica protein kinase (DMPK) gene. RNA hairpins formed by elongated DMPK transcripts sequester RNA-binding proteins, leading to mis-splicing of numerous pre-mRNAs. Here, we have investigated whether DM1-associated muscle pathology is related to deregulation of central metabolic pathways, which may identify potential therapeutic targets for the disease. In a well-characterized mouse model for DM1 (HSALR mice), activation of AMPK signaling in muscle was impaired under starved conditions, while mTORC1 signaling remained active. In parallel, autophagic flux was perturbed in HSALR muscle and in cultured human DM1 myotubes. Pharmacological approaches targeting AMPK/mTORC1 signaling greatly ameliorated muscle function in HSALR mice. AICAR, an AMPK activator, led to a strong reduction of myotonia, which was accompanied by partial correction of misregulated alternative splicing. Rapamycin, an mTORC1 inhibitor, improved muscle relaxation and increased muscle force in HSALR mice without affecting splicing. These findings highlight the involvement of AMPK/mTORC1 deregulation in DM1 muscle pathophysiology and may open potential avenues for the treatment of this disease.


Conflict of interest statement

M. Sinnreich owns shares of Novartis and is coinventor on a patent application for drug discovery in DM1 (EP 16/166212.7). M. Sinnreich’s institution (University Hospital Basel) has received research support from CSL Behring and Roche, not in relation to this study. C. Angelini is part of the European Board of Genzyme-Sanofi.

Figures

Figure 1
Figure 1. AMPK and mTORC1 pathways do not respond to starvation in HSALR muscle.
(A and B) Two-month-old HSALR and control (Ctrl) mice were examined in fed conditions and after 24 hours of starvation (St24). Immunoblots for phospho- (P) and total proteins of the AMPK (A) and mTORC1 (B) pathways reveal reduced AMPK activation and increased phosphorylation of some mTORC1 targets upon starvation in mutant muscle. Samples were run on the same gel but were noncontiguous. Protein quantification is given for AMPKP172 (n = 4 Ctrl and 3 HSALR), CaMKIIβM, AktP473, mTORP2448 (Fed, n = 3; St24, n = 4), and S6P235/6 (Fed, n = 3; St24, n = 7 Ctrl and 6 HSALR). Data are relative to fed control mice and are mean ± SEM. *P < 0.05, **P < 0.01, ***P < 0.001, 2-way ANOVA with Tukey’s multiple comparisons test correction. (C) Immunostaining on muscle cross sections from fed and starved (St24) HSALR and control (Ctrl) mice shows high levels of phospho-S6 in mutant muscle upon starvation. Scale bar: 100 μm.
Figure 2
Figure 2. AMPK and mTORC1 pathways can be modulated by caloric and pharmacological treatments in HSALR muscle.
Immunoblots for phospho- (P) and total AMPK and S6 proteins reveal efficient inhibition of mTORC1 signaling upon 45 hours of starvation (St45, A) and with metformin (MetF, B) or rapamycin (Rapa, C) treatment in muscle from HSALR mice. AMPK activation shows a trend toward increase in mutant muscle with metformin treatment (B). Samples were run on the same gel but were noncontiguous. Protein quantification is shown for AMPKP172 and S6P235/6 (Fed, n = 3; St45, n = 4 Ctrl and 3 HSALR; Veh [B], n = 3; MetF, n = 4; Veh [C], n = 4 Ctrl and 3 HSALR; Rapa, n = 3 per genotype). Data are relative to fed (A) or vehicle-treated (B and C) control mice and are mean ± SEM. *P < 0.05, **P < 0.01, ***P < 0.001, 2-way ANOVA with Tukey’s multiple comparisons test correction.
Figure 3
Figure 3. HSALR muscles show mild deregulation of the autophagic flux.
(A) Immunoblots for autophagy-related proteins show accumulation of autophagic substrates in HSALR TA muscle in fed conditions. A reduced LC3I-to-LC3II switch is observed in mutant muscle upon 24 hours of starvation (St24), compared with control (Ctrl). Samples were run on the same gel but were noncontiguous. (Fed, n = 3; St24, n = 7 Ctrl and 6 HSALR for LC3 ratio, n = 4 for p62.) For LC3I and LC3II levels, see Supplemental Figure 3A. (B) HSALR mice expressing GFP-LC3 display increased number of GFP-positive puncta in TA muscle compared with control (Ctrl) in fed conditions (n = 3 Ctrl and 4 HSALR), but reduced accumulation after 24 hours of starvation (St24, n = 3). Scale bar: 50 μm; 10 μm for insets. A volume unit (vol) corresponds to 2.8 × 103 μm3. (C) Treatment with colchicine (Colch) leads to milder changes in LC3II levels in TA muscle from fed and starved HSALR mice, compared with control (Ctrl) mice. For LC3II/LC3I quantification, see Supplemental Figure 3C. (D) Immunostaining of muscle sections from starved control (Ctrl) and HSALR mice reveals no major accumulation of p62 or ubiquitinated proteins in mutant muscle. Scale bar: 100 μm. Data are relative to control fed mice and represent mean ± SEM. *P < 0.05, **P < 0.01, ***P < 0.001, ****P < 0.0001, 2-way ANOVA with Tukey’s multiple comparisons test correction.
Figure 4
Figure 4. HSALR muscles display perturbed response of autophagy to caloric and pharmacological treatments.
(A) Expression of autophagy-related genes is efficiently upregulated after 45 hours of starvation (St45) in HSALR TA muscle. Data are normalized to Actn2 levels (Fed, n = 4; St45, n = 4 Ctrl and 3 HSALR). Data are relative to control fed mice and represent mean ± SEM. *P < 0.05, **P < 0.01, ***P < 0.001, 2-way ANOVA with Tukey’s multiple comparisons test correction. (B) Immunoblots reveal limited switch from LC3I to LC3II in HSALR muscle upon 45 hours of starvation (St45) compared with controls (Ctrl). Samples were run on the same gel but were noncontiguous. For LC3II/LC3I quantification, see Supplemental Figure 4B. (C) Levels of the inhibited phosphorylated form of ULK1 (SerP757) remain slightly higher upon starvation in HSALR muscle, compared with control (Ctrl) muscle. For quantification, see Supplemental Figure 4C. (D and E) Immunoblots for LC3 show blunted induction of LC3II upon rapamycin (Rapa, D) or metformin (MetF, E) treatments, compared with controls (Ctrl). For LC3II/LC3I quantification, see Supplemental Figure 4, D and E. Samples were run on the same gel but were noncontiguous.
Figure 5
Figure 5. Autophagy perturbation contributes to muscle alterations in DM1.
(A) Protein lysates from muscle biopsies of control individuals (C1–5) and DM1 patients (P1–3) were analyzed for phospho- (P) and total proteins of the AMPK and PKB/Akt–mTORC1 pathways. (B) MyoD-transduced fibroblasts from controls (Ctrl) and DM1 patients were differentiated to myotubes and subjected to growth medium (GM) or deprived conditions (PBS) for 3 hours. Immunoblots for phospho- (P) and total proteins reveal increased phospho-S6 levels upon deprivation in the 3 cell lines of DM1 patients (DM-L1–3), compared with controls. Samples were run on the same gel but were noncontiguous. Quantification is given for deprived conditions; values are mean ± SEM of technical replicates. (C) Immunoblots for LC3 marker show defective accumulation of LC3II in DM1 myotubes upon energy and amino acid deprivation (PBS) as well as with deprived conditions and chloroquine treatment (Chloro), compared with control cells (Ctrl). Quantification of LC3II/LC3I ratio is shown for 2 DM1 cell lines (DM-L1/2) in enriched (GM) and deprived conditions; values are mean ± SEM of technical replicates. (D) H&E stain reveals the presence of vacuolated fibers (arrows) in muscle biopsy from 1 DM1 patient, together with lysosomal accumulation (arrowheads) observed by immunostaining in some affected muscle fibers (red, bottom panel). Scale bars: 50 μm. (E) Vacuoles (arrows) are observed in muscle from aging HSALR mice; the periphery of the vacuoles is strongly reactive with anti-LAMP1 antibodies (red, bottom panel), indicating accumulation of lysosomal structures in these regions. High density of lysosomes is also observed in nonvacuolated muscle fibers from 12-month-old (12M) mutant mice (arrowheads), compared with muscle from age-matched control mice (Ctrl). Scale bars: 50 μm.
Figure 6
Figure 6. AICAR markedly decreases myotonia in HSALR mice and reduces mis-splicing in mutant muscle.
(A) In vitro tetanic stimulation of EDL muscle reveals strongly increased relaxation time in HSALR muscle. (B) Metformin (MetF) treatment does not reduce muscle late relaxation time in 4-month-old (Ctrl, n = 5; HSALR, n = 6 Veh and 8 MetF) and 12-month-old (Ctrl, n = 3; HSALR, n = 7 Veh and 8 MetF) HSALR mice, as compared with vehicle-treated mutant mice. (C) Inclusion of exon 7a of the Clcn1 gene is not changed in muscle from metformin-treated (MetF) HSALR mice, compared with vehicle-treated mice (n = 3). (D) Immunoblots for phospho- and total S6 protein reveal efficient inhibition of indirect AMPK target in muscle from control (Ctrl) and mutant mice treated with AICAR. Samples were run on the same gel but were noncontiguous. (E) AICAR treatment normalizes the time to relax of HSALR muscle upon tetanic stimulation, compared with muscle from vehicle-treated (Veh) mutant mice. (F) Late relaxation time is significantly reduced in EDL muscle from 2-month-old (n = 3 Ctrl and 4 HSALR), 8-month-old (Ctrl, n = 3; HSALR, n = 6 Veh and 7 AICAR), and 12-month-old (n = 4 Veh and 5 AICAR) HSALR mice that were treated with AICAR, as compared with age-matched vehicle-treated (Veh) mutant mice. (GK) End-point PCR (G) and quantitative PCR (H and I) reveal strong reduction in exon 7a inclusion of the Clcn1 gene in muscle from HSALR mice treated with AICAR, compared with vehicle-treated (Veh) mutant mice (Ctrl, n = 3; HSALR, n = 5 Veh and 4 AICAR [G], n = 5 [I]). Protein levels of CLC-1 are also increased in mutant muscle from AICAR-treated mice (J and K, n = 3 Ctrl and 4 HSALR). (L) Quantitative PCR shows similar transcript levels of Rbm3 in muscle from AICAR-treated and untreated mice (n = 3 Ctrl and 4 HSALR). Data represent mean ± SEM. *P < 0.05, **P < 0.01, ***P < 0.001, ****P < 0.0001, 2-way ANOVA with Tukey’s multiple comparisons test correction (except 12M AICAR, unpaired 2-tailed Student’s t test).
Figure 7
Figure 7. Rapamycin improves muscle function in HSALR mice via splicing-independent mechanisms.
(A) Rapamycin treatment strongly reduces the time to relax of HSALR muscle upon tetanic stimulation, compared with muscle from vehicle-treated (Veh) mutant mice. (B) Rapamycin (Rapa) treatment significantly reduces late relaxation time of muscle from 4-month-old (Ctrl, n = 4; HSALR, n = 8 Veh and 10 Rapa) and 12-month-old (Ctrl, n = 3; HSALR, n = 5 Veh and 6 Rapa) HSALR mice, as compared with age-matched, vehicle-treated mutant mice. (C and D) Splicing (C) and overall transcript expression (D) of the Clcn1 gene are not modified in muscle from rapamycin-treated (Rapa) HSALR mice, compared with vehicle-treated (Veh) mutant mice. Values are relative to vehicle-treated control mice (n = 3 Ctrl and 4 Veh-treated and 5 Rapa-treated HSALR). (E) Treatment with AZD8055 for 10 days efficiently reduces phosphorylation of mTORC1 target, S6, in control (Ctrl) and HSALR muscle, but does not change AMPK activation. Samples were run on the same gel but were noncontiguous. (F) AZD8055 (AZD) does not reduce late relaxation time of EDL mutant muscle, compared with vehicle-treated (Veh) mutant mice. (n = 3 Ctrl and 5 Veh and 8 AZD HSALR mice.) Data represent mean ± SEM. **P < 0.01, ***P < 0.001, ****P < 0.0001, 2-way ANOVA with Tukey’s multiple comparisons test correction.
Figure 8
Figure 8. AMPK activation by AICAR leads to nuclear foci dispersion in HSALR muscle.
(A and B) H&E (A) and NADH (B) stains reveal no major change in muscle histopathology and oxidative capacity upon AICAR or rapamycin treatment in HSALR mice. Arrowheads and arrows show internalized nuclei and vacuoles, respectively. Scale bars: 50 μm (A), 200 μm (B). (C) Immunostaining for type IIA (bright red), IIX (dark red), and IIB (green) myosin heavy chains (MHC) reveals no significant change in the respective proportion of fiber types in TA mutant muscle upon AICAR (n = 3 Ctrl and 4 HSALR) or rapamycin (n = 4) treatment, compared with vehicle-treated HSALR mice (n = 6 Ctrl and 7 HSALR). Scale bar: 200 μm. (D) FISH on TA muscle sections with a Cy3-CAG10 DNA probe shows accumulation of nuclear foci in HSALR muscle (arrows). The number of stained nuclei is significantly decreased upon AICAR treatment (n = 4), but not with rapamycin (Rapa, n = 3), compared with vehicle-treated (Veh) mutant mice. Foci are not detected in control (Ctrl) muscle. Scale bar: 50 μm; 2 μm for insets. Data in C and D represent mean ± SEM. *P < 0.05, **P < 0.01, 2-way ANOVA with Tukey’s multiple comparisons test correction.
Figure 9
Figure 9. Scheme depicting the deregulation of AMPK/mTORC1 signaling pathways in DM1 muscle.
In healthy muscle, the pathways are tightly regulated depending on external and internal stimuli (e.g., growth factors, energy, nutrients). Upon fasting, mTORC1 is inhibited, while AMPK is activated, leading to the induction of autophagy. In DM1, skeletal muscle does not respond to fasting conditions. Deregulation of the AMPK/mTORC1 signaling likely contributes to muscle dysfunction: rapamycin, an inhibitor of mTORC1, and AICAR, an AMPK agonist, both lead to marked reduction of myotonia and normalize muscle weakness in DM1 mice. The underlying mechanisms include RNA splicing–dependent and –independent mechanisms.

Similar articles

Cited by

References

    1. Machuca-Tzili L, Brook D, Hilton-Jones D. Clinical and molecular aspects of the myotonic dystrophies: a review. Muscle Nerve. 2005;32(1):1–18. doi: 10.1002/mus.20301. - DOI - PubMed
    1. Brook JD, et al. Molecular basis of myotonic dystrophy: expansion of a trinucleotide (CTG) repeat at the 3′ end of a transcript encoding a protein kinase family member. Cell. 1992;69(2):385. doi: 10.1016/0092-8674(92)90418-C. - DOI - PubMed
    1. Mahadevan M, et al. Myotonic dystrophy mutation: an unstable CTG repeat in the 3′ untranslated region of the gene. Science. 1992;255(5049):1253–1255. doi: 10.1126/science.1546325. - DOI - PubMed
    1. Lin X, et al. Failure of MBNL1-dependent post-natal splicing transitions in myotonic dystrophy. Hum Mol Genet. 2006;15(13):2087–2097. doi: 10.1093/hmg/ddl132. - DOI - PubMed
    1. Mankodi A, et al. Myotonic dystrophy in transgenic mice expressing an expanded CUG repeat. Science. 2000;289(5485):1769–1773. doi: 10.1126/science.289.5485.1769. - DOI - PubMed

MeSH terms