. 2017 Feb;20(2):260-270.
doi: 10.1038/nn.4470. Epub 2017 Jan 9.

Prefrontal cortical control of a brainstem social behavior circuit

Affiliations

Prefrontal cortical control of a brainstem social behavior circuit

Tamara B Franklin et al. Nat Neurosci. 2017 Feb.

Abstract

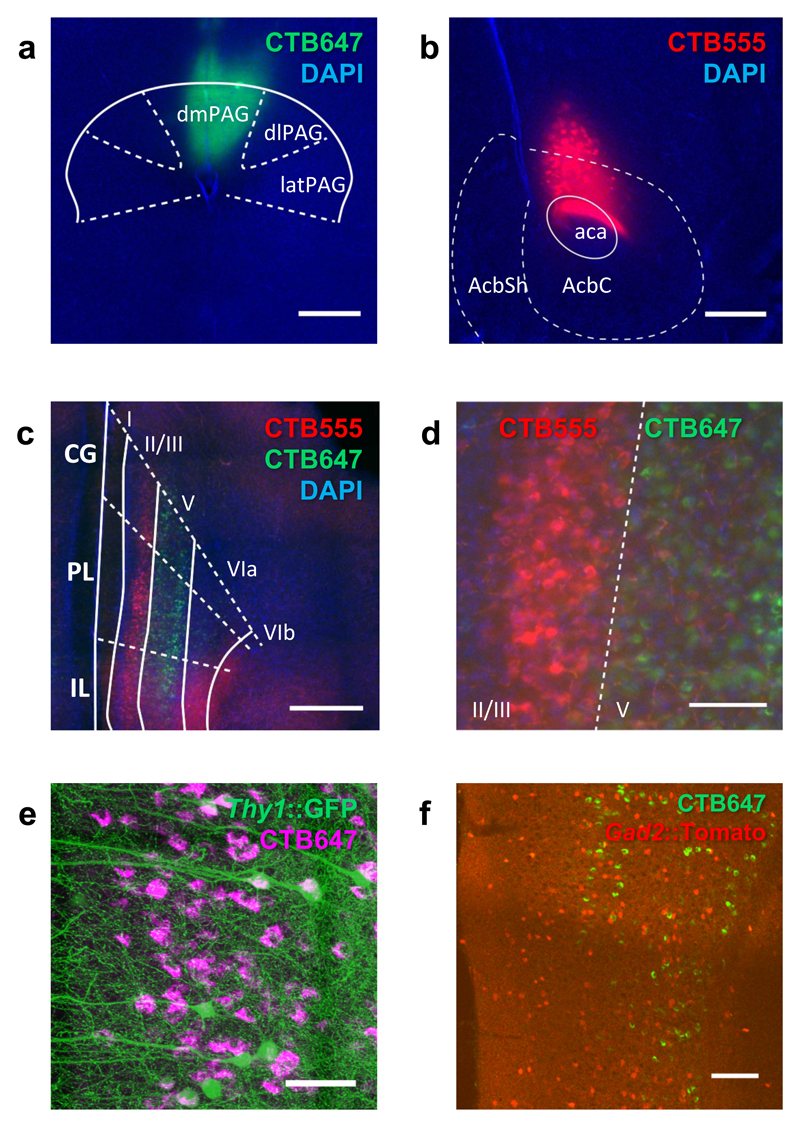
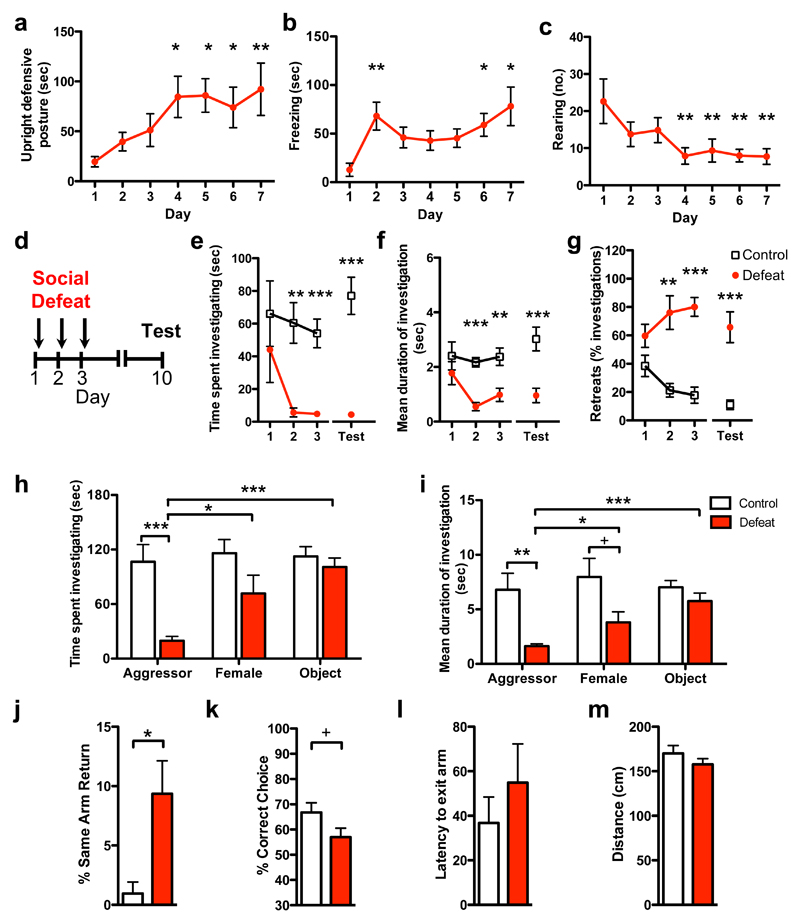
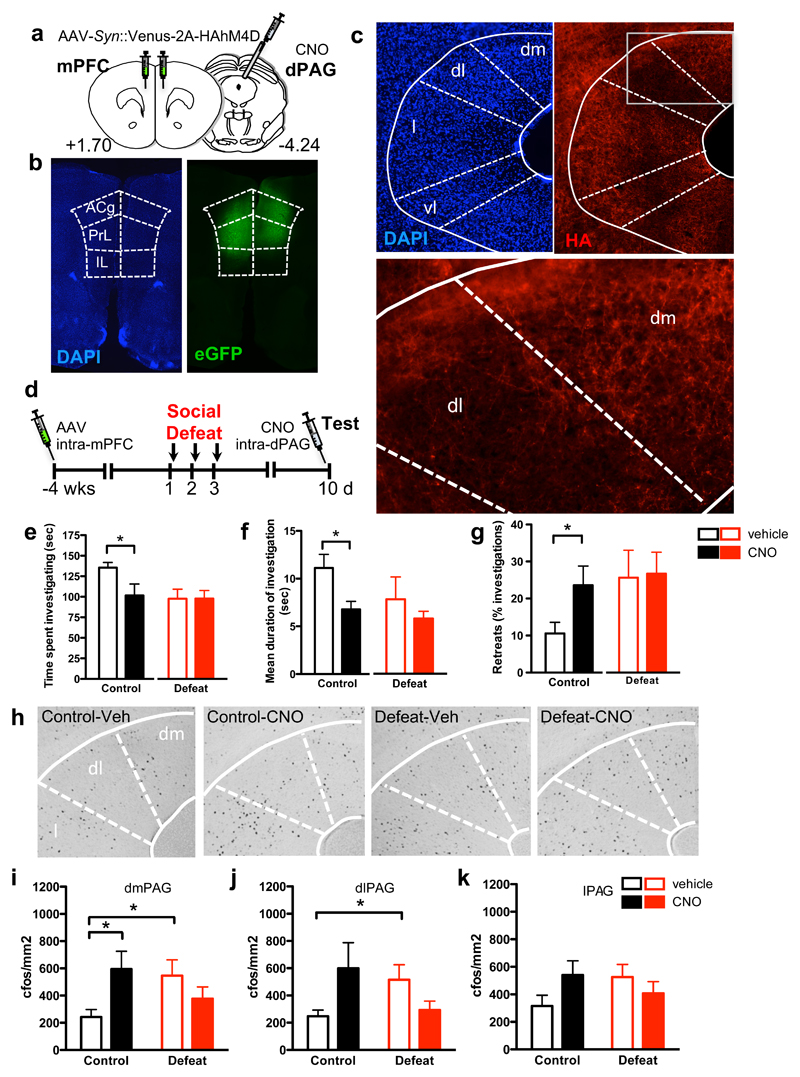
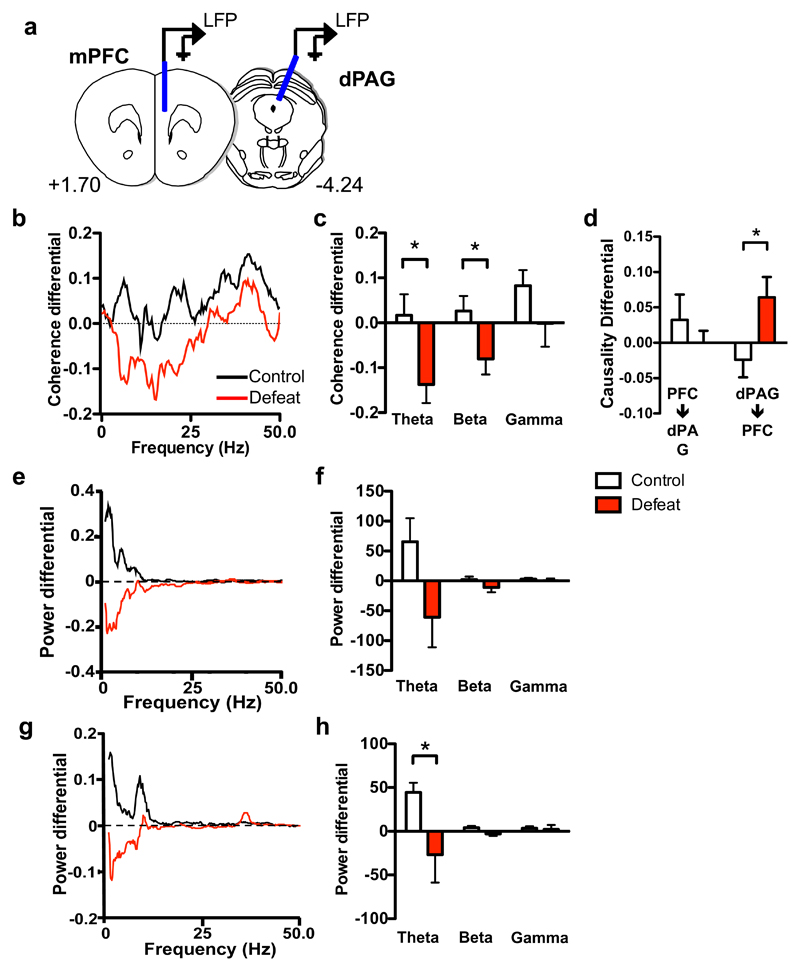
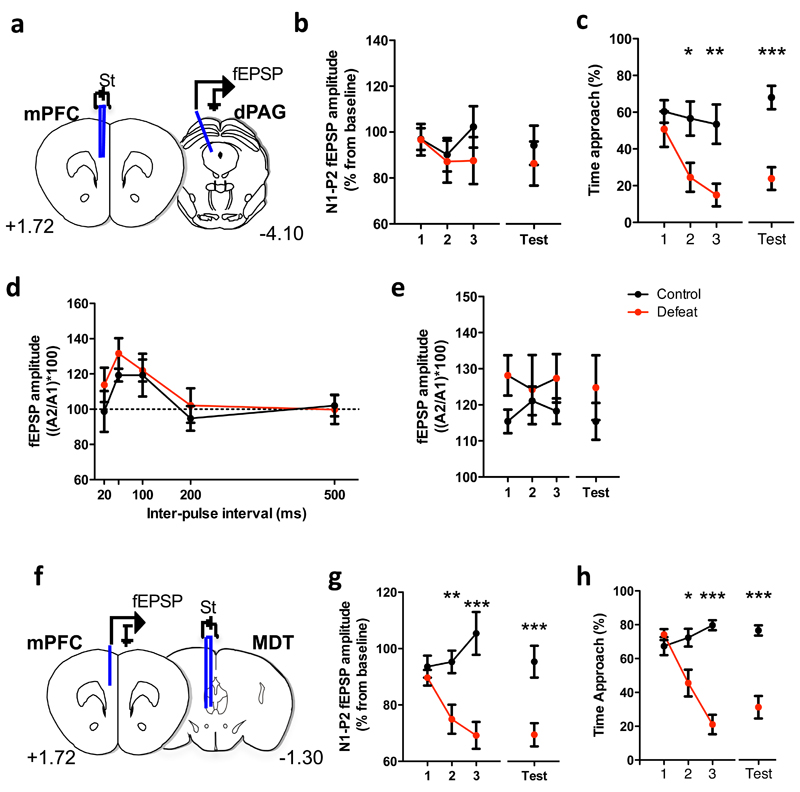
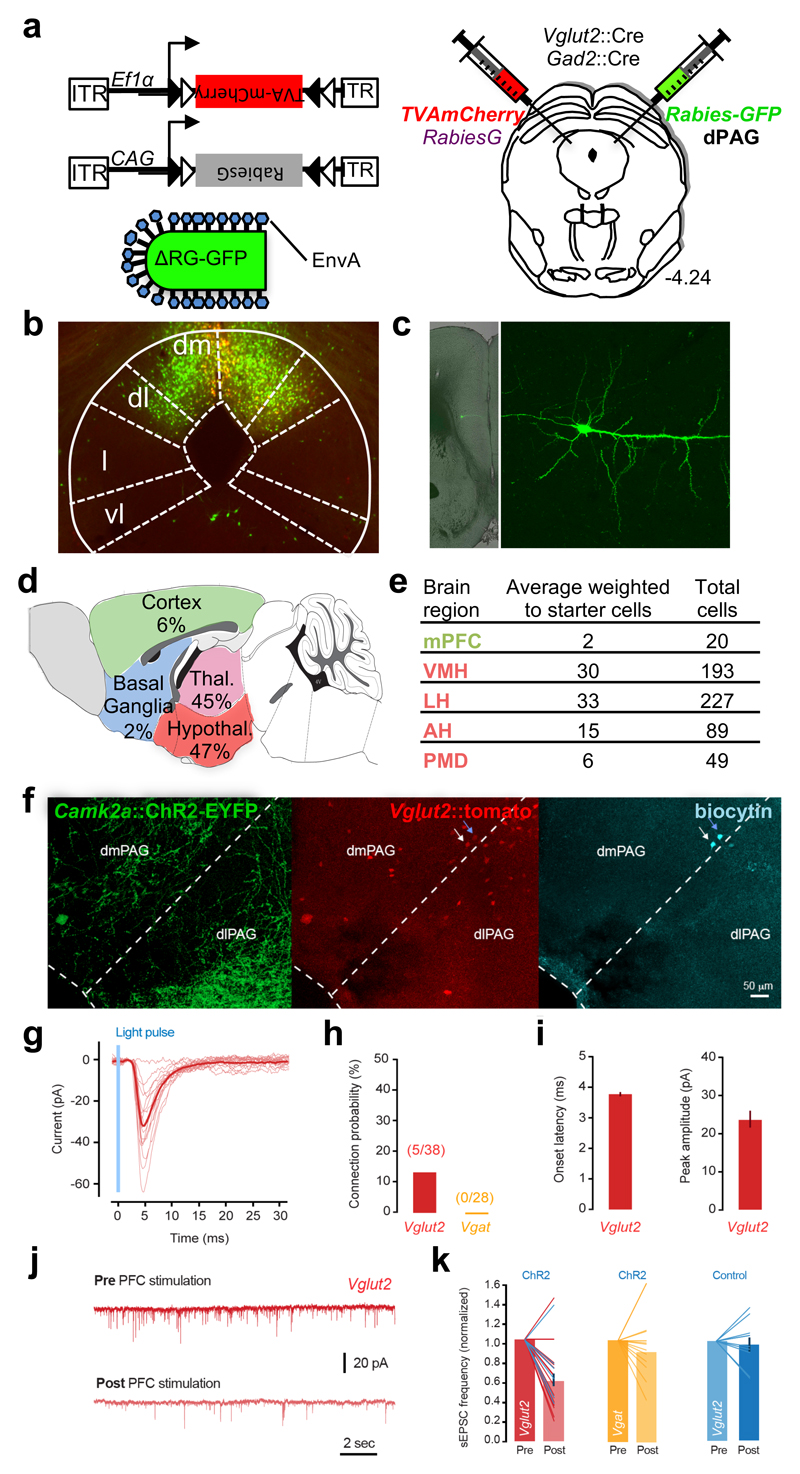
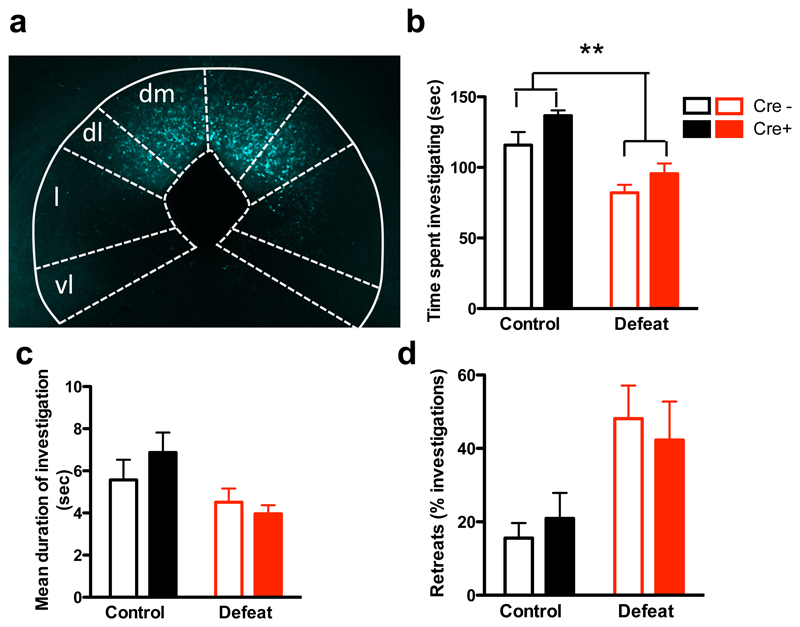
The prefrontal cortex helps adjust an organism's behavior to its environment. In particular, numerous studies have implicated the prefrontal cortex in the control of social behavior, but the neural circuits that mediate these effects remain unknown. Here we investigated behavioral adaptation to social defeat in mice and uncovered a critical contribution of neural projections from the medial prefrontal cortex to the dorsal periaqueductal gray, a brainstem area vital for defensive responses. Social defeat caused a weakening of functional connectivity between these two areas, and selective inhibition of these projections mimicked the behavioral effects of social defeat. These findings define a specific neural projection by which the prefrontal cortex can control and adapt social behavior.


Figures

Figure 1
Figure 1. Layer 5 excitatory neurons in mPFC make direct projections to dPAG.
(a-d) Mice were injected with retrograde tracers (CTB647, green) in dPAG (a) and (CTB 555, red) in NAc (b). Low (c) and high (d) magnification images of retrogradely labeled CTB647 (dPAG projecting) and CTB555 (NAc projecting) neurons in layer 5 and layer 2/3, respectively, of mPFC. (e) Representative image of retrogradely labeled CTB647 (dPAG projecting) neurons in mPFC of a Thy1::GFP mouse. (f) Representative image of retrogradely labeled CTB647 (dPAG projecting) cells demonstrating that these cells are not co-localized with GABAergic neurons in mPFC of Gad2::Cre;RC::LSL-Tomato mouse (scale bar = 500 μm in a-c, 100 μm in d, f; 50 μm in e). n=2.
Figure 2
Figure 2. Induction of social avoidance by social defeat.
Defensive responses elicited in the resident mouse by exposure to an aggressive intruder were increased across social defeat sessions as measured by significantly increased (a) upright-defensive postures (day: F[6,7] = 3.8, P = 0.0042) and (b) freezing (day: F[6,7] = 4.2, P = 0.0022), and decreased exploration as measured by (c) rearing (day: F[6,7] = 3.2, P = 0.012). (d) Social approach behavior was measured each day for three days during an anticipatory period in which the intruder was restrained behind a wire mesh barrier immediately prior to social defeat or the control condition, as well as one week later (Test). Defeated mice (e) spent less time investigating a novel aggressor (defeat: F[1,22]=16.1, P = 0.006; day: F[3,22] = 2.8, P = 0.047; defeat x day: F[3,66] = 2.4, P = 0.079), (f) had shorter investigation bouts (defeat: F[1,22]=20.2, P=0.0002; day: F[3,22] = 2.6, P=0.063, defeat x day: F[3,66]=2.1, P=0.11), and (g) retreated from social investigation periods more than control mice (defeat: F[1,17] = 57.9, P < 0.0001; day: F[3,22]=1.9, P = 0.14; defeat x day: F[3,51] = 8.7, P < 0.0001). All deficits persisted one week after the final defeat session. Defeated mice (h) spent less time (defeat: F[1,12] = 7.6, P=0.018, stimulus: F[2,12] = 12.4, P = 0.0002, defeat x stimulus: F[2,24] = 8.9, P=0.0013) and (i) exhibited shorter investigation bouts (defeat: F[1,12] = 7.5, P=0.018, stimulus: F[2,12]=5.0, P=0.016, defeat x stimulus: F[2,24] = 3.9, P=0.033) toward both male and female intruders, but not a novel object when compared to control mice. In the Y-maze, defeated mice showed (j) increased same-arm returns (t(14)=2.9, P=0.013) and (k) a trend for decreased spontaneous alternation (t(14)=1.9, P=0.081), but (l) no change in latency to exit the start arm or (m) overall distance travelled. +P<0.1; *P<0.05; *P<0.01; ***P<0.001). n=7-12.
Figure 3
Figure 3. Inhibition of mPFC-dPAG projections mimics social defeat.
(a) Mice were infected bilaterally in mPFC with AAV expressing Venus fluorescent protein and HA-tagged hM4D (AAV-Syn::Venus-2A-HA-hM4D), implanted with a guide cannula over dPAG, subjected to social defeat or control conditions, and infused locally in dPAG with CNO or vehicle before testing for social interaction. (b) Representative image of Venus labeled infected cells in the mPFC. (c) HA immunostaining revealed expression of hM4D in mPFC projections in the PAG. (d) AAV-Syn::Venus-2A-HAhM4D-WPRE was infused into the mPFC four weeks prior to social defeats. Social approach behavior was measured one week later (Test), immediately after intra-dPAG administration of CNO or vehicle. Control mice administered CNO prior to testing (e) spent less time investigating the aggressor (defeat: F[1,1]=3.54, P=0.067; CNO: F[1,1]=2.42, P=0.13; defeat x CNO: F[1,39]=2.32, P=0.14; t(19)=2.1, P=0.047) (f) exhibited shorter investigation bouts (defeat: F[1, 1]=2.23, P=0.14; CNO: F[1,1]=5.1, P=0.03; defeat x CNO: F[1, 38]=1.47, P=0.23; t(19)=2.9, p=0.0088) and (g) made more retreats (defeat: F[1, 1]=2.78, P=0.1; CNO: F[1,1]=0.54, P=0.47; defeat x CNO: F[1, 38]=2.5, P=0.12; t(19)=2.2, p=0.042), than vehicle treated control animals. Behavior of CNO-treated control animals was indistinguishable from vehicle-treated defeated mice and no effect of CNO treatment was detected in defeated animals. (h) Representative images and (i-k) quantification of cFos immunopositive cells in (i) dorsomedial (dm), (j) dorsolateral (dl), and (k) lateral (l) PAG of mice described above. Vehicle-treated defeated mice showed a significant increase in cFos immunopositive cells in dmPAG and dlPAG when compared to vehicle-treated control animals. CNO-treatment of control mice resulted in a significant increased in cFos immunopositive cells in dmPAG when compared to vehicle-treated control mice, matching levels seen in defeated mice (dmPAG, defeat x drug: F[1,38]=6.74, P=0.013, dlPAG, defeat x drug: F[1,38]=6.5, P=0.015). No significant effect of CNO treatment was observed in defeated mice. n=10-12. *P<0.05.
Figure 4
Figure 4. Social defeat weakens mPFC-dPAG functional connectivity.
(a) Placement of electrodes used to measure local field potential (LFP) activity in mPFC and dPAG. Functional connectivity between mPFC and dPAG was estimated by measuring coherence between LFP signals at the two electrodes during the anticipatory period on day 3 compared to day 1 of social defeat. (b, c) Relative coherence (coherence differential) was significantly reduced in defeated mice compared to control animals (theta: U=9, p=0.048, beta: U=8, p=0.035). (d) Theta band causality between mPFC and dPAG was measured on day 3 compared to day 1 of social defeat. Relative causality (causality differential) was significantly higher in the PAG->mPFC direction in defeated mice compared to control animals (U=12, p=0.038). (e-h) Power spectra differential between day 1 and day 3 in (e, f) mPFC and (g, h) PAG when control and defeated mice were proximal to the aggressor. Defeated mice had lower power in the theta band in the PAG compared to control mice (U=6, P=0.018). Power spectra were averaged across mice. Power in each frequency band was calculated as the sum of the power values. n=7-8, *P<0.05.
Figure 5
Figure 5. Evolution of synaptic field potentials in sensory and defeated mice across testing days.
Location of recording and stimulating electrodes implanted chronically in the mPFC and dPAG (a)mPFC and MDT (f). (b) Similar mPFC-dPAG fEPSP amplitude in control and defeated mice but (g) significant difference in MDT-mPFC fEPSP amplitude in defeated mice compared to control (F[3,51]=5.58, p=0.0022). fEPSP amplitude is expressed as percent change in mean values (±SEM) during home cage exploration on the first day (baseline) for the N1-P2 interval during the social interaction (control: black circles; defeated group: red circles). Significant behavioral adaptation to social defeat in (c) mice with electrodes implanted in the mPFC and dPAG (F[1,10]=10.51, p=0.0088) (h) and mice with electrodes implanted in the MDT and dPAG (F[3,57]=13.93, p<0.0001). (d) Paired-pulse facilitation (PPF) of fEPSP recorded in the dPAG after stimulation of mPFC. Expressed as percent amplitude change (± SE) of the second fEPSP of the first for the five interpulse intervals. (e) Evolution of the paired-pulse facilitation of fEPSP along the sessions recorded in the dPAG after stimulation of mPFC. PPF, n=4; mPFC-dPAG, n=7; MDT-mPFC, n=10-12.
Figure 6
Figure 6. Cell-specific retrograde tracing identifies targets of PFC projections in PAG.
(a) Vglut2::Cre and Vgat::Cre mice were infected in dPAG with Cre-dependent AAV expressing TVA-mCherry and rabies protein G and subsequently infected with EnvA pseudo-typed G-deleted rabies-GFP virus whose infection is limited to cells expressing TVA and that can form viable virions only in cells expressing protein G. In this manner infection by rabies-GFP is limited to cells expressing Cre and trans-synaptic infection occurs only monosynaptically. AAV and rabies were injected unilaterally into dPAG from opposing angles to avoid co-infection of the pipette tract. (b) Cre-dependent targeting of TVA-mCherry (red) and rabies-GFP (green) to Vglut2+ neurons in dPAG. (c) Low (left) and high (right) magnification images of a retrograde labeled rabies-GFP infected layer V pyramidal cell in mPFC. (d) Summary of rabies-infected neurons (GFP+, mCherry-) in the forebrain of Vglut2::Cre animals (percentage of the average number of retrograde neurons weighted to the number of starter cells present in each animal). (e) Number and weighted average of rabies-infected neurons in mPFC and hypothalamic nuclei (VMH, LH, AH and PMD) of Vglut2::Cre animals (n = 8). (f) Example images showing dense ChR2+ axonal projections (green) from the PFC in the PAG, cell bodies of Vglut2+ neurons (red) and two neurons filled with biocytin and processed after whole-cell recording (cyan). Blue arrow points to a neuron with monosynaptic input from the PFC and white arrow indicates a neuron without PFC input. (g) Light-evoked monosynaptic EPSCs in a Vglut2+ neuron. Light red traces are individual trials and dark red is average. (h) Mean probability of detecting PFC inputs in Vglut2 and Vgat neurons. (i) Average EPSC onset latency across all cells (left, 3.6±0.14 msec) and response peak amplitude (right, 23.1±4.5 pA). (j) Example traces of spontaneous EPSC recordings in a Vglut2+ neuron that did not receive direct PFC input, before and after 20 trials of ChR2+ stimulation (20 pulses at 10 Hz) of PFC terminals, showing a decrease in sEPSC frequency. (k) Mean change in sEPSC frequency with PFC ChR2 stimulation for all Vglut2+ neurons (left, 58.5±6% or control, P<0.0001, n=25) and Vgat+ neurons (middle, 91.4±8% of control, P=0.34, n=12). Right, light stimulation without ChR2 infection does not change sEPSC frequency. Lines show individual datapoints; in the left panel blue lines are cells with direct PFC input.
Figure 7
Figure 7. PAG inhibition increases social approach.
(a-d) Selective hM4D-mediated inhibition of Vglut2+ neurons in dPAG. Vglut2::Cre mice were infected with AAV-Syn::DIO-hM4D-mCherry in the dPAG (a), subjected to control and social defeat, and treated with CNO before social interaction testing. Defeated mice (b) spent less time investigating the intruder (defeat: F[1,11]=26.77, P=0.0003), (c) had shorter investigation bouts (defeat: F[1, 11] = 6.72, P = 0.025), and (d) made more retreats (defeat: F[1,11] =22.28, P=0.0006) when compared to control animals. Systemic administration of CNO in Cre+ mice (b) increased time spent investigating the intruder (treatment: F[1,11] = 13.12, P=0.004), but had no effect on (c) duration of investigation bouts or (d) retreats when compared to Cremice. n=6-7.

References

    1. Arnsten AF. Stress signalling pathways that impair prefrontal cortex structure and function. Nature reviews Neuroscience. 2009;10:410–422. - PMC - PubMed
    1. Takahashi A, Nagayasu K, Nishitani N, Kaneko S, Koide T. Control of intermale aggression by medial prefrontal cortex activation in the mouse. PloS one. 2014;9:e94657. - PMC - PubMed
    1. Carrier N, Kabbaj M. Sex differences in social interaction behaviors in rats are mediated by extracellular signal-regulated kinase 2 expression in the medial prefrontal cortex. Neuroscience. 2012;212:86–92. - PMC - PubMed
    1. Wang F, et al. Bidirectional control of social hierarchy by synaptic efficacy in medial prefrontal cortex. Science. 2011;334:693–697. - PubMed
    1. Covington HE, 3rd, et al. Antidepressant effect of optogenetic stimulation of the medial prefrontal cortex. The Journal of neuroscience : the official journal of the Society for Neuroscience. 2010;30:16082–16090. - PMC - PubMed

Publication types