

Genome-wide association study identifies distinct genetic contributions to prognosis and susceptibility in Crohn's disease
- PMID: 28067912
- PMCID: PMC5730041
- DOI: 10.1038/ng.3755
Genome-wide association study identifies distinct genetic contributions to prognosis and susceptibility in Crohn's disease
Abstract
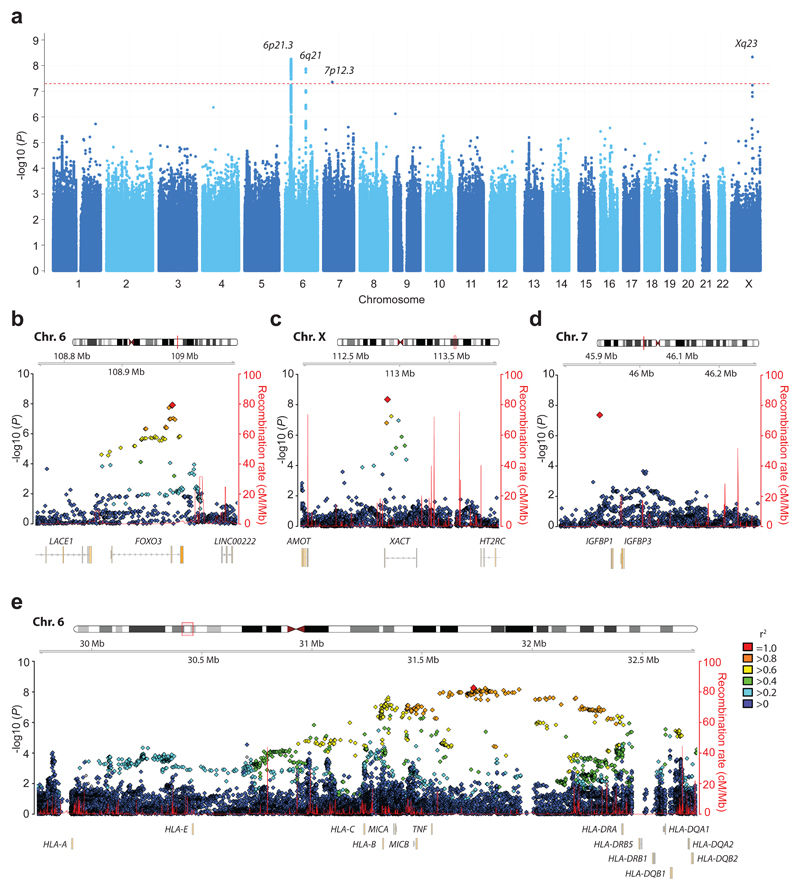
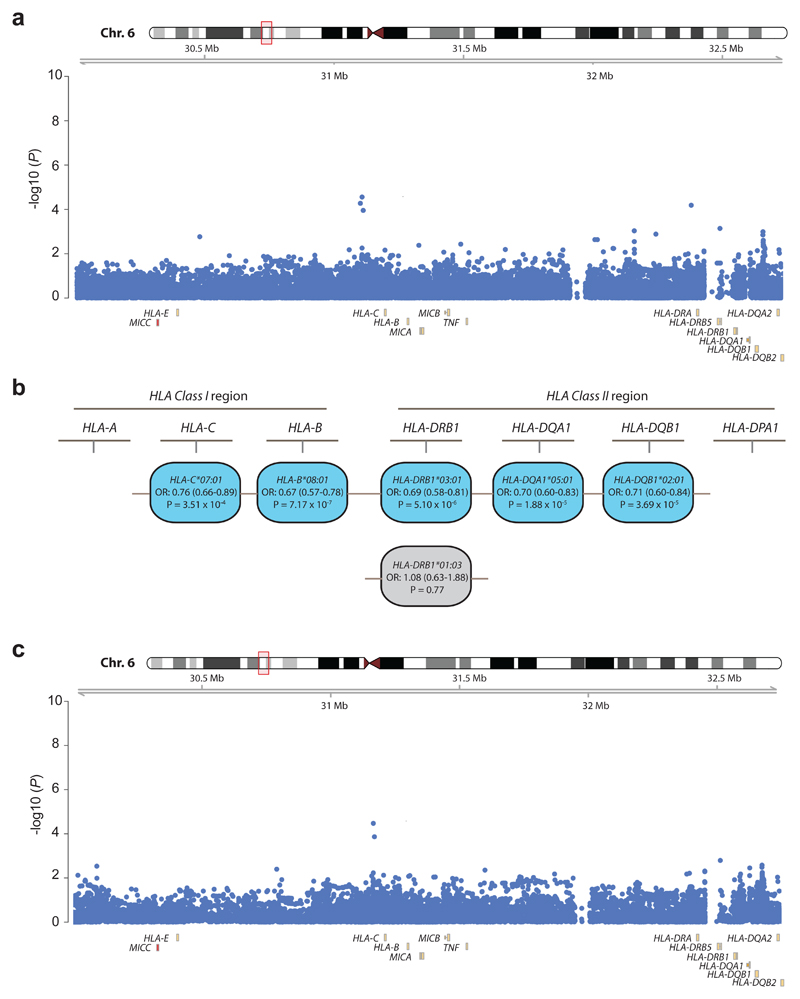
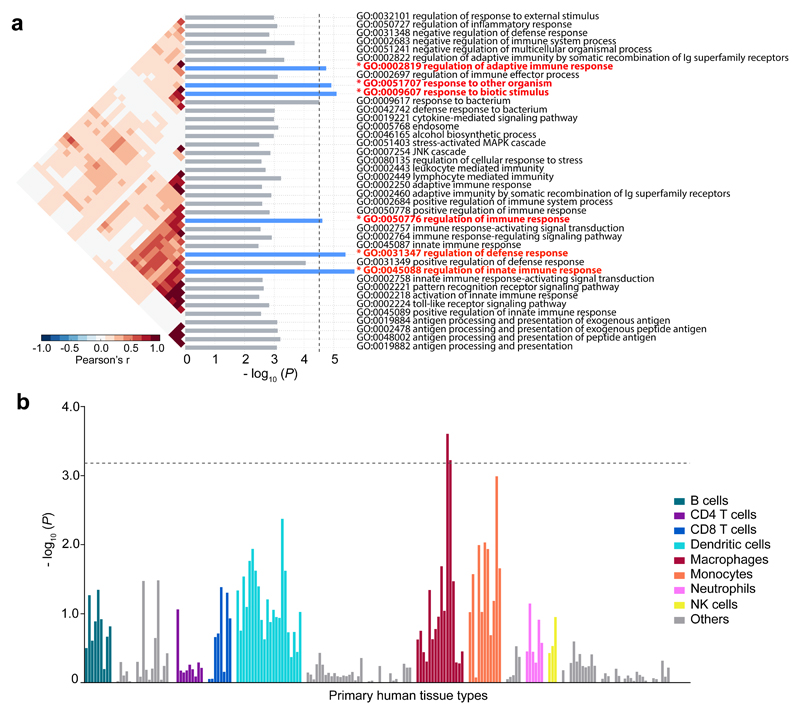
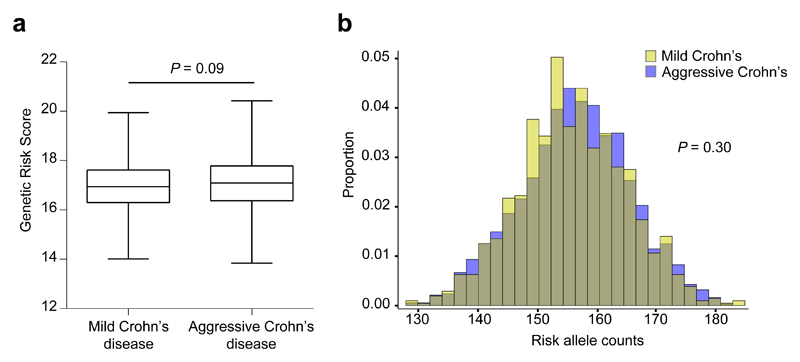
For most immune-mediated diseases, the main determinant of patient well-being is not the diagnosis itself but instead the course that the disease takes over time (prognosis). Prognosis may vary substantially between patients for reasons that are poorly understood. Familial studies support a genetic contribution to prognosis, but little evidence has been found for a proposed association between prognosis and the burden of susceptibility variants. To better characterize how genetic variation influences disease prognosis, we performed a within-cases genome-wide association study in two cohorts of patients with Crohn's disease. We identified four genome-wide significant loci, none of which showed any association with disease susceptibility. Conversely, the aggregated effect of all 170 disease susceptibility loci was not associated with disease prognosis. Together, these data suggest that the genetic contribution to prognosis in Crohn's disease is largely independent of the contribution to disease susceptibility and point to a biology of prognosis that could provide new therapeutic opportunities.
Conflict of interest statement
The authors declare no competing financial interests
Figures
Comment in
-
IBD: Genetic differences in Crohn's disease susceptibility and outcome.Nat Rev Gastroenterol Hepatol. 2017 May;14(5):266-268. doi: 10.1038/nrgastro.2017.24. Epub 2017 Mar 8. Nat Rev Gastroenterol Hepatol. 2017. PMID: 28270696 No abstract available.
References
-
- Jess T, et al. Changes in clinical characteristics, course, and prognosis of inflammatory bowel disease during the last 5 decades: a population-based study from Copenhagen, Denmark. Inflamm Bowel Dis. 2007;13:481–489. - PubMed
-
- Pincus T. Long-term outcomes in rheumatoid arthritis. Br J Rheumatol. 1995;34(Suppl 2):59–73. - PubMed
-
- Weinshenker BG, et al. The natural history of multiple sclerosis: a geographically based study. I. Clinical course and disability. Brain. 1989;112(Pt 1):133–146. - PubMed
MeSH terms
Grants and funding
- C0482/MRF_/MRF_/United Kingdom
- MR/M00533X/1/MRC_/Medical Research Council/United Kingdom
- G0800759/MRC_/Medical Research Council/United Kingdom
- ETM/137/CSO_/Chief Scientist Office/United Kingdom
- MR/L019027/1/MRC_/Medical Research Council/United Kingdom
- WT_/Wellcome Trust/United Kingdom
- MC_UU_00008/7/MRC_/Medical Research Council/United Kingdom
- MC_UU_12010/7/MRC_/Medical Research Council/United Kingdom
- G0800675/MRC_/Medical Research Council/United Kingdom
- G0600329/MRC_/Medical Research Council/United Kingdom
- NIHR-RP-R3-12-026/DH_/Department of Health/United Kingdom
LinkOut - more resources
Full Text Sources
Other Literature Sources
Medical
