. 2016 Dec 13;24(6):795-806.
doi: 10.1016/j.cmet.2016.09.013. Epub 2016 Oct 27.

Long-Term Administration of Nicotinamide Mononucleotide Mitigates Age-Associated Physiological Decline in Mice

Affiliations

Long-Term Administration of Nicotinamide Mononucleotide Mitigates Age-Associated Physiological Decline in Mice

Kathryn F Mills et al. Cell Metab. .

Abstract

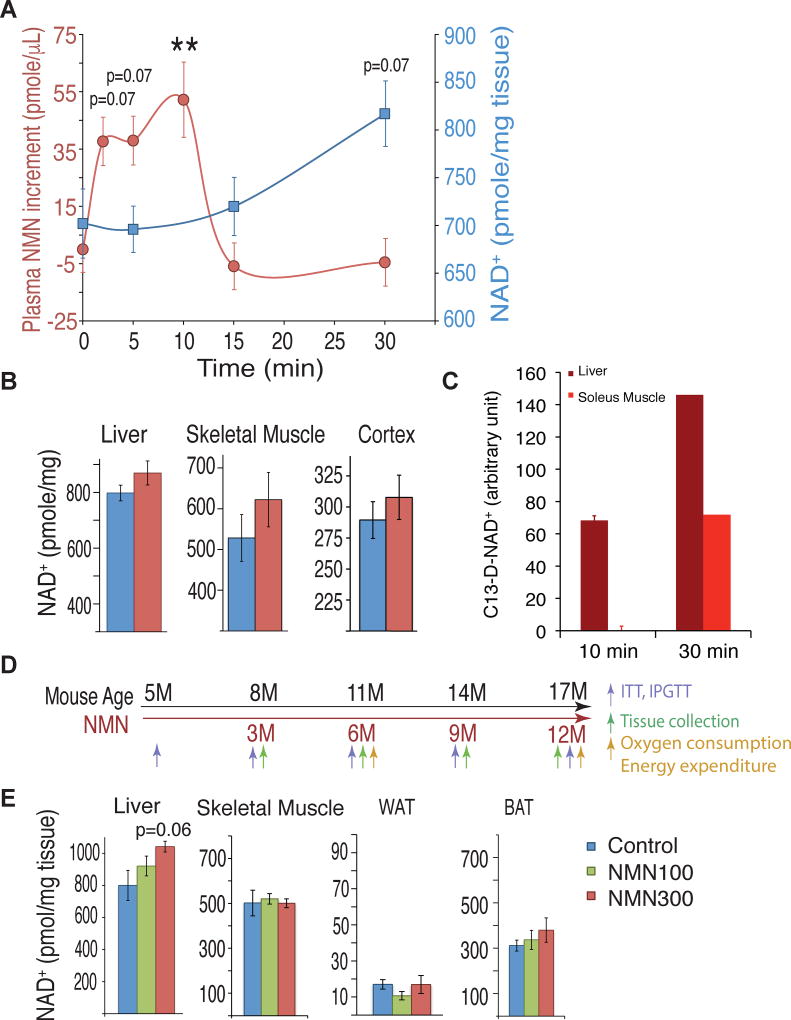
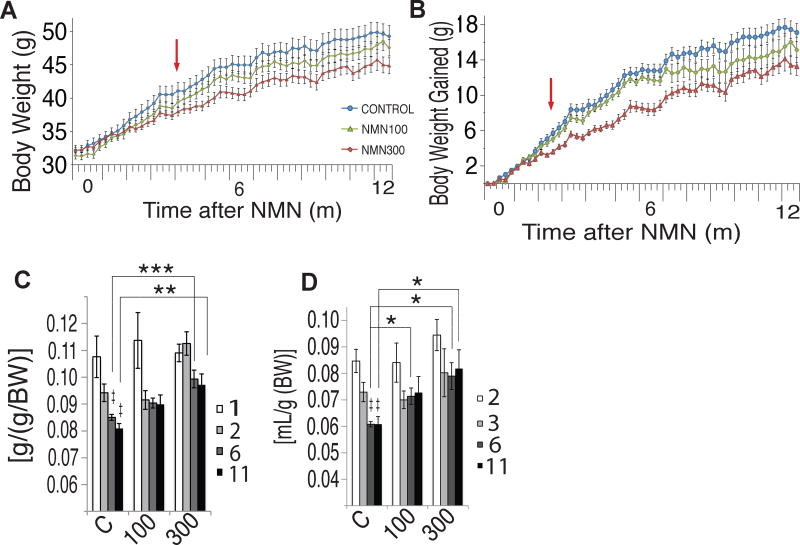
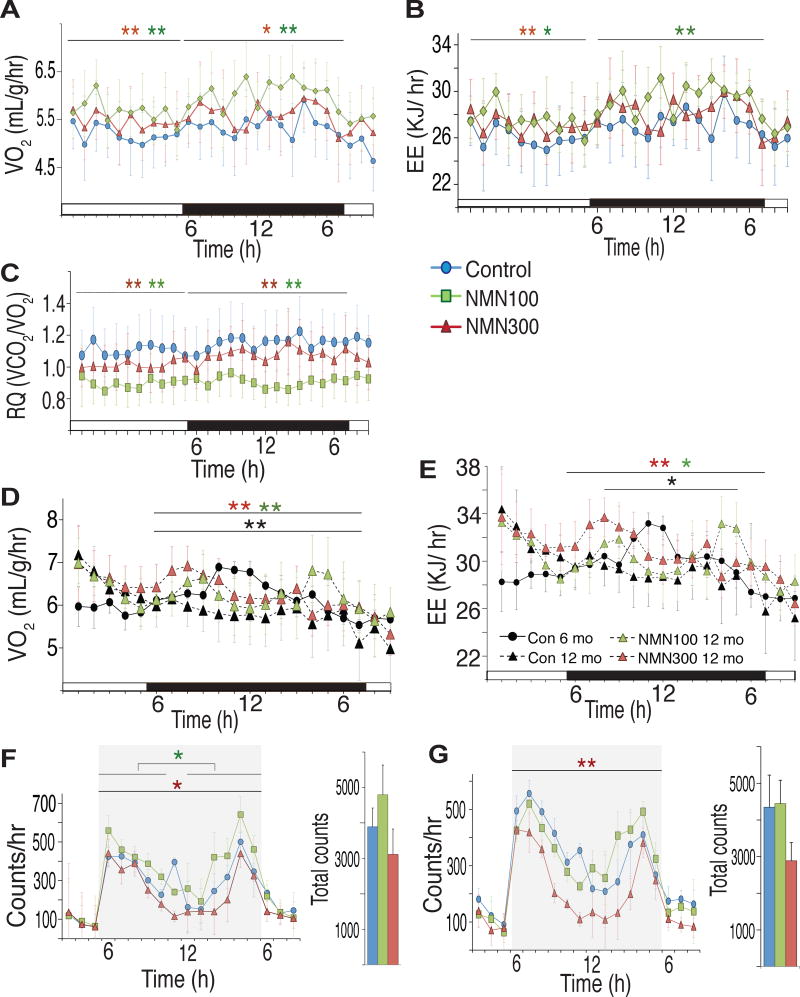
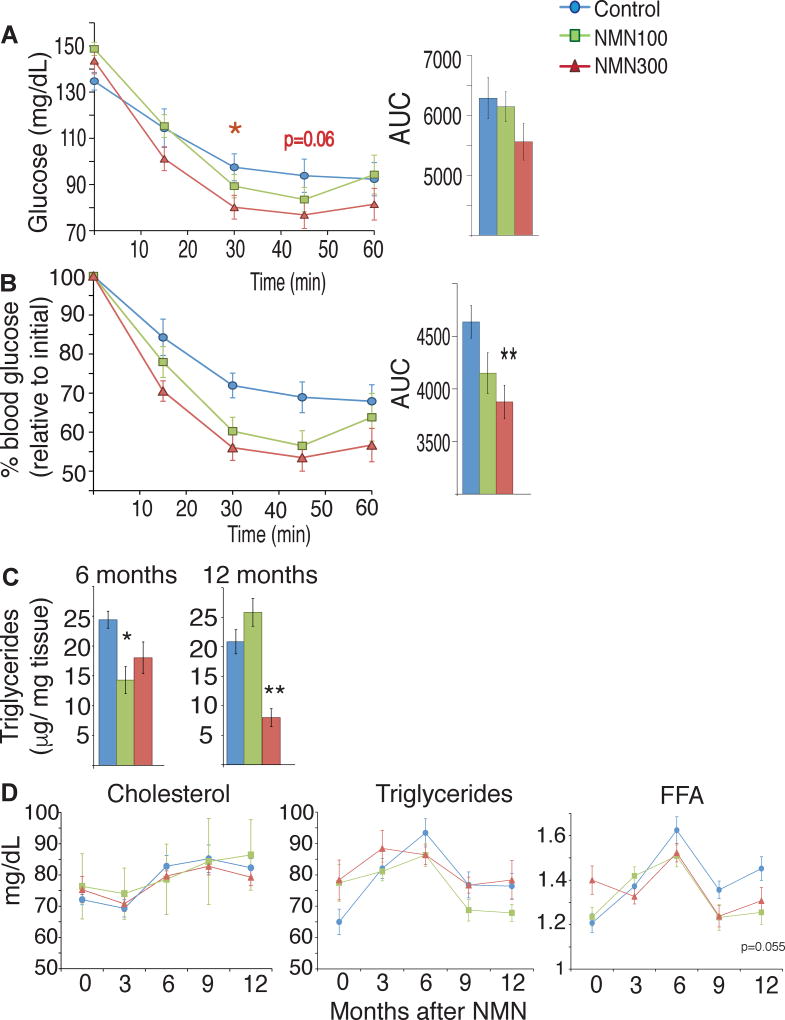
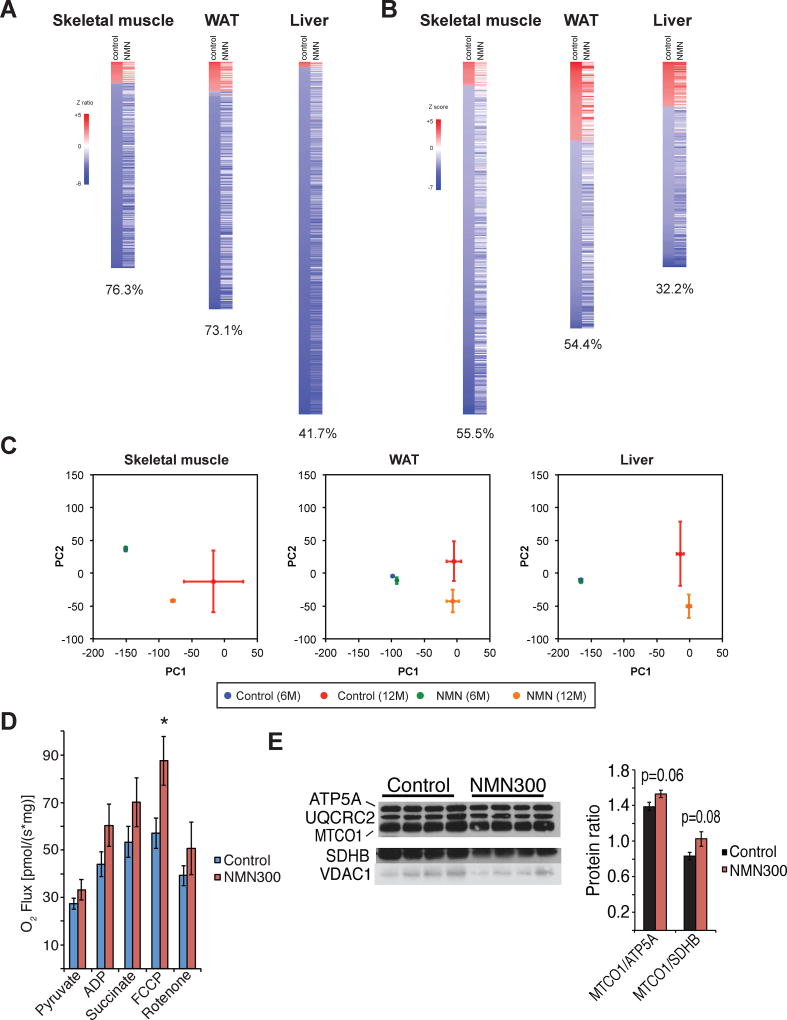
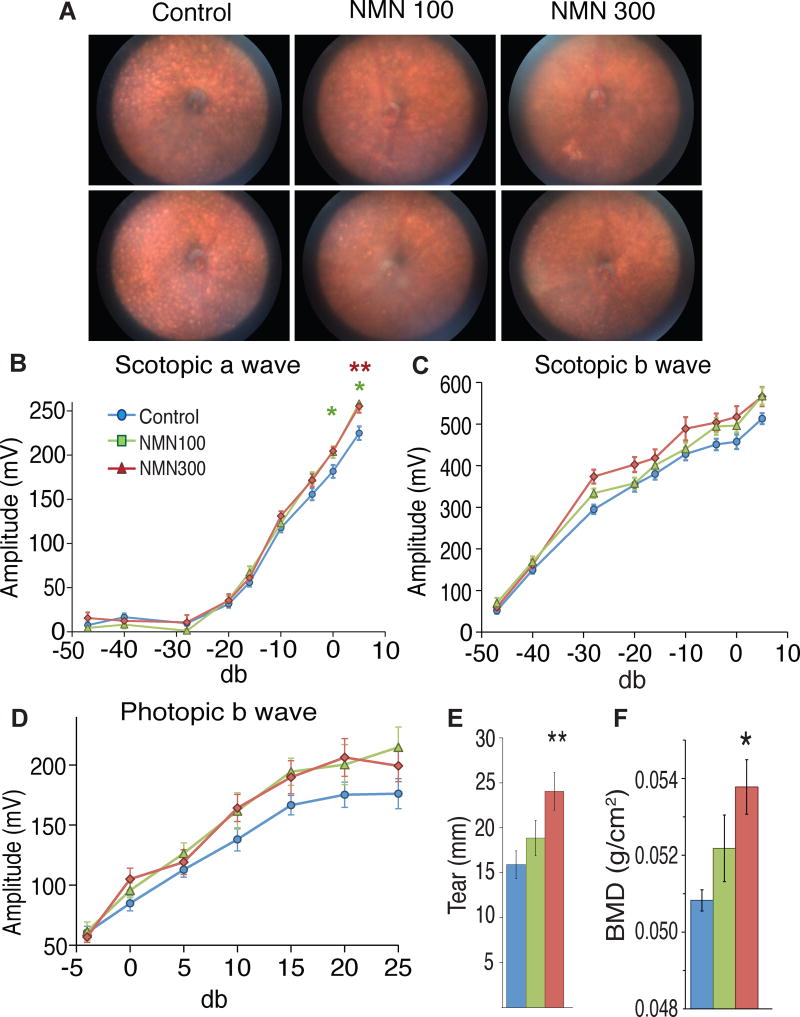
NAD+ availability decreases with age and in certain disease conditions. Nicotinamide mononucleotide (NMN), a key NAD+ intermediate, has been shown to enhance NAD+ biosynthesis and ameliorate various pathologies in mouse disease models. In this study, we conducted a 12-month-long NMN administration to regular chow-fed wild-type C57BL/6N mice during their normal aging. Orally administered NMN was quickly utilized to synthesize NAD+ in tissues. Remarkably, NMN effectively mitigates age-associated physiological decline in mice. Without any obvious toxicity or deleterious effects, NMN suppressed age-associated body weight gain, enhanced energy metabolism, promoted physical activity, improved insulin sensitivity and plasma lipid profile, and ameliorated eye function and other pathophysiologies. Consistent with these phenotypes, NMN prevented age-associated gene expression changes in key metabolic organs and enhanced mitochondrial oxidative metabolism and mitonuclear protein imbalance in skeletal muscle. These effects of NMN highlight the preventive and therapeutic potential of NAD+ intermediates as effective anti-aging interventions in humans.

Keywords: NAD(+); NAD(+) precursor; NMN; aging; anti-aging; energy metabolism; eye function; glucose metabolism; insulin sensitivity; mitochondria; nicotinamide mononucleotide.


Figures

Figure 1
Figure 1. Oral administration of nicotinamide mononucleotide (NMN) increases plasma NMN and tissue NAD+ levels in mice
Three to four month-old C57BL/6N mice were given NMN either by oral gavage (300mg/kg) or ad libitum in the drinking water (100 or 300 mg/kg/day). (A) Plasma NMN (red circles) and liver NAD+ (blue squares) levels were measured by HPLC after oral gavage (300 mg/kg) (n=5–13 per time point). **p<0.01 compared to 0 min. (B) NAD+ levels 1 hr after oral gavage (300mg/kg) in the liver, skeletal muscle, and cortex of control (blue) and NMN-administered (red) mice (n=10 mice per group). (C) Doubly-labeled isotopic NAD+ (C13-D-NAD+) were measured in the liver and soleus muscle by mass spectrometry at 10 and 30 min time points after orally administering doubly-labeled isotopic NMN (C13-D-NMN) (n=3 at 10 min and n=1 at 30 min). The areas under the curves of C13-D-NAD+ were calculated by subtracting the background values of PBS controls. (D) A scheme showing the long-term NMN administration and various analyses. NMN (100 or 300 mg/kg/day) was dissolved into the drinking water and administered ad libitum to C57BL/6N male mice for 12 months, starting at 5 months of age. Experiments were performed at intervals to document the changes over time, as indicated. (E) NAD+ was measured in the liver, skeletal muscle, white adipose tissue (WAT), and brown adipose tissue (BAT) of control (blue) and 100 (green) and 300 (red) mg/kg/day NMN-administered mice 6 months after NMN administration (at 11 months of age) (n=4–5 per group). All values are presented as mean ± SEM.
Figure 2
Figure 2. NMN-administered mice exhibit suppression of age-associated weight gain while maintaining food and water intake during the process of aging
Body weight and food and water intake were monitored throughout the 12-month intervention period in control (blue) and 100 (green) and 300 (red) mg/kg/day NMN-administered mice. (A and B) Body weight and body weight gain were plotted for each group (n=9–15 per group). Red arrows indicate the starting point for both the statistically significant differences between control and 300 mg/kg/day NMN groups (p<0.001 from two-way repeated measures ANOVA), and statistically significant dose dependent effects [p<0.05 (A) or P<0.01 (B) from one-way repeated measures ANOVA with the unweighted linear term]. (C and D) Food and water intake were measured throughout the 12-month intervention period. Symbol (‡) indicates statistically significant differences within control groups (P<0.05); 6- and 11-month (dark grey and black bars, respectively) vs. 1-month (white bar) in food intake, and 6- and 11-month (dark grey and black bars, respectively) vs. 2-month (white bar) in water intake. Asterisks indicate statistically significant differences compared to controls at indicated time points (*p<0.05, **p<0.01, ***p<0.001 by ANOVA with Tukey post-hoc test; n=9–15 per group). All values are presented as mean ± SEM.
Figure 3
Figure 3. NMN-administered mice show enhancement of energy metabolism and higher physical activity during the dark time
(A–C) Oxygen consumption (VO2), energy expenditure (EE) and respiratory quotient (RQ) were measured after 12 months of NMN administration using indirect calorimetry (n= 5 per group). Red and green asterisks indicate statistically significant differences between 100 (green) or 300 (red) mg/kg/day NMN-administered and control mice by Wilcoxon matched-pairs singled-ranks test with Bonferroni adjusted p values (*p<0.017, **p<0.003). (D and E) VO2 and EE were compared between 6 and 12 months after NMN administration (6-month controls, black circles; 12-month controls, black triangles; 12-month 100 mg/kg/day NMN-administered mice, green triangles; 12-month 300 mg/kg/day NMN-administered mice, red triangles). Black, green and red asterisks indicate statistically significant differences between controls at 6 and 12 months after NMN administration, between 100 mg/kg/day and control groups at 12 months, and between 300 mg/kg/day and control groups at 12-months of NMN treatment, respectively. Wilcoxon matched-pairs singled-ranks test with Bonferroni adjusted p values was used (*p<0.01, **p<0.002; n=5 per group). (F and G) Ambulations (F) and rearings (G) were measured for control (blue) and 100 (green) and 300 (red) mg/kg/day NMN-administered mice at 12–15 months of age. Hourly counts from 3pm to 8am (left) and total counts during the dark time (6pm-5am, right) were presented. Red and green asterisks indicate statistically significant differences between 100 (green) or 300 (red) mg/kg/day NMN-administered and control mice by Wilcoxon matched-pairs singled-ranks test with Bonferroni adjusted p values (*p<0.017, **p<0.003; n=9–10 per group). Black bars (A–E) and grey shaded areas (F–G) represent the dark period.
Figure 4
Figure 4. NMN-administered mice show improved insulin sensitivity and lipid profiles
Metabolic tests were performed after 12 months of their respective NMN doses. Results from control, 100 and 300 mg/kg/day NMN-administered mice are shown in blue, green, and red, respectively. (A) Blood glucose levels were measured at the indicated times in insulin tolerance tests for body weight-matched mice after a 4 hr fast (n=10–15 per group). Areas under the curves (AUCs) are also shown at right. (B) Relative blood glucose levels were calculated for body weight-matched mice (n=10–15 per group). Glucose levels at each time point are normalized to that at 0 min. AUCs are also shown at right. (C) Intrahepatic triglyceride levels were measured after an overnight fast from animals in each group at 6 and 12 months after NMN administration (n=4–5 per group). (D) Plasma concentrations of cholesterol, triglycerides, and free fatty acids (FFA) were measured at 3, 6, 9 and 12 months of NMN treatment, after an overnight fast (n=10–15 per group). All values are presented as mean ± SEM. Asterisks indicate statistical significances compared to controls using one-way ANOVA (*p<0.05; **p<0.01).
Figure 5
Figure 5. Long-term NMN administration prevents age-associated gene expression changes in peripheral tissues and enhances mitochondrial respiratory capacity in skeletal muscle
(A and B) Microarray analysis was conducted to compare gene expression profiles of skeletal muscle, white adipose tissue (WAT), and the liver in control and 300 mg/kg/day NMN-administered mice at 6 and 12 months after NMN administration. Throughout the figure, up-regulated genes are shown in red and down-regulated genes are shown in blue (n=4 per group). Heat maps in (A) reveal changes in individual gene expression. Genes that were significantly changed in control mice were selected by the rank product method (false discovery ratios [FDR] < 0.05) and ordered based on Z ratios of control mice. NMN administration inhibits age-induced changes in gene expression of skeletal muscle (76.3% of 300 genes), WAT (73.1% of 360 genes), and liver (41.7% of 513 genes). Heat maps in (B) are shown from the parametric analysis of gene-set enrichment (PAGE). Biological pathways that were significantly changed in control mice were selected by PAGE (P < 0.05) and ordered based on Z scores of control mice. NMN administration inhibits these age-induced changes in pathways of skeletal muscle (55.5% of 299 pathways), WAT (54.4% of 226 pathways) and liver (32.2% of 174 pathways). (C) Principal component analysis (PCA) was performed on the entire gene sets. The x- and y-axes indicate the first and the second principal components (PC1 and PC2), respectively. All values are presented as mean ± SEM (n=4). (D) High-resolution respirometry was performed for permeabilized skeletal muscles from control (n=7) and 300 mg/kg/day NMN-treated (NMN300; n=9) mice at 6 months. Mitochondrial oxidative respiration was measured by addition of pyruvate, ADP, succinate, a mitochondrial uncoupler FCCP, and a complex I inhibitor rotenone. (E) Protein levels of nuclear DNA-encoded and mitochondrial DNA-encoded mitochondrial proteins (ATP5A, UQCRC2, SDHB, VDAC1 vs. MTCO1, respectively) were measured in mitochondrial extracts from control and 300 mg/kg/day NMN-treated skeletal muscles at 6 months (left panel; n=4). The protein ratios of MTCO1 to ATP5A or SDHB were calculated by quantitating signal intensities of each band (right panel). All values are presented as mean ± SEM.
Figure 6
Figure 6. Long-term NMN administration significantly improves eye function, tear production, and bone mineral density in aged C57BL/6N mice
Eye function and bone density were analyzed after 12 months of NMN administration (at 17 months of age). Results from control and 100 and 300 mg/kg/day NMN-administered mice are shown in blue, green, and red, respectively. (A) Representative fundus biomicroscopy photos from control, 100 and 300 mg/kg/day NMN-administered mice (n=5 per group). Light-colored spots due to the rd8 mutation carried by C57BL/6N mice were seen in all 5 control mice. Two and four out of 5 mice at 100 and 300 mg/kg/day, respectively, showed dramatic reductions in these spots. (B–D) Scotopic a, scotopic b, and photopic b waves were measured by electroretinography (ERG) and analyzed using two-way RANOVA with Dunnett T3 post-hoc test (n=10–24 per group). (E) Tear production was assessed using a modified Schirmer’s test and analyzed by one-way ANOVA (n=20 per group). (F) Bone mineral density (BMD) was evaluated by dual-energy X-ray absorptiometry (DEXA) and analyzed by one-way ANOVA (n=4–5 per group). All values are presented as mean ± SEM. Asterisks indicate statistical significances compared to controls (*p<0.05; **p<0.01).

Similar articles

Cited by

References

    1. Anderson R, Bitterman K, Wood J, Medvedik O, Cohen H, Lin S, Manchester J, Gordon J, Sinclair D. Manipulation of a nuclear NAD+ salvage pathway delays aging without altering steady-state NAD+ levels. J. Biol. Chem. 2002;277:18881–18890. - PubMed
    1. Aredo B, Zhang K, Chen X, Wang CX, Li T, Ufret-Vincenty RL. Differences in the distribution, phenotype and gene expression of subretinal microglia/macrophages in C57BL/6N (Crb1 rd8/rd8) versus C57BL6/J (Crb1 wt/wt) mice. J. Neuroinflammation. 2015;12:6. - PMC - PubMed
    1. Balan V, Miller GS, Kaplun L, Balan K, Chong ZZ, Li F, Kaplun A, VanBerkum MF, Arking R, Freeman DC, et al. Life span extension and neuronal cell protection by Drosophila nicotinamidase. J. Biol. Chem. 2008;283:27810–27819. - PMC - PubMed
    1. Barzilai N, Crandall JP, Kritchevsky SB, Espeland MA. Metformin as a Tool to Target Aging. Cell Metab. 2016;23:1060–1065. - PMC - PubMed
    1. Belenky P, Racette FG, Bogan KL, McClure JM, Smith JS, Brenner C. Nicotinamide riboside promotes Sir2 silencing and extends lifespan via Nrk and Urh1/Pnp1/Meu1 pathways to NAD+ Cell. 2007;129:473–484. - PubMed

Publication types

MeSH terms